Airport Back-of-House Logistics: A 2026 Guide for Australian Airport Operators and Tenants
The front-of-house experience at an Australian airport is the part the public sees: check-in, security, retail, food and beverage, lounges, boarding. The back-of-house is the part that makes the front of house possible. Catering trucks delivering meals into airside, waste containers moving in the opposite direction, retail and F&B replenishment to outlets across the terminal, cleaning consumables, linen for lounges and crew rest areas, ground handling supplies, fuel, maintenance parts, and the security screening that every airside-bound item must pass through. When the BOH operating model works, no passenger ever notices it. When it fails, the front of house fails with it.
Airport BOH is also one of the most under-discussed parts of the Australian aviation system. The capital expansion programme across the four ACCC-monitored airports (Sydney, Melbourne, Brisbane and Perth) is now reported by the ACCC at around $20 billion of proposed major infrastructure spend over the next decade. Western Sydney International opens in late 2026 with capacity to handle 10 million passengers initially and a long-term design horizon of 82 million by the 2060s. Melbourne Airport announced a $4.5 billion terminal expansion in March 2026. Brisbane is delivering its $5 billion Future BNE programme. Perth is progressing a new terminal. Almost every dollar of that capital programme has BOH operating model implications, and most of them are still being worked through.
This guide is the practitioner's framework for airport BOH logistics in Australia in 2026. It covers what airport BOH actually includes, why it is uniquely complex compared with other major-venue BOH operations, the strategic decisions facing operators and major tenants under the current capacity expansion programme, the demand modelling discipline that determines whether new terminals open with a viable operating model, the workforce and security architecture, and the common failure modes that the new generation of terminal projects can avoid.
What airport back-of-house actually covers
Airport BOH operations break into three connected zones, each with its own operating model, regulatory regime, and security framework.
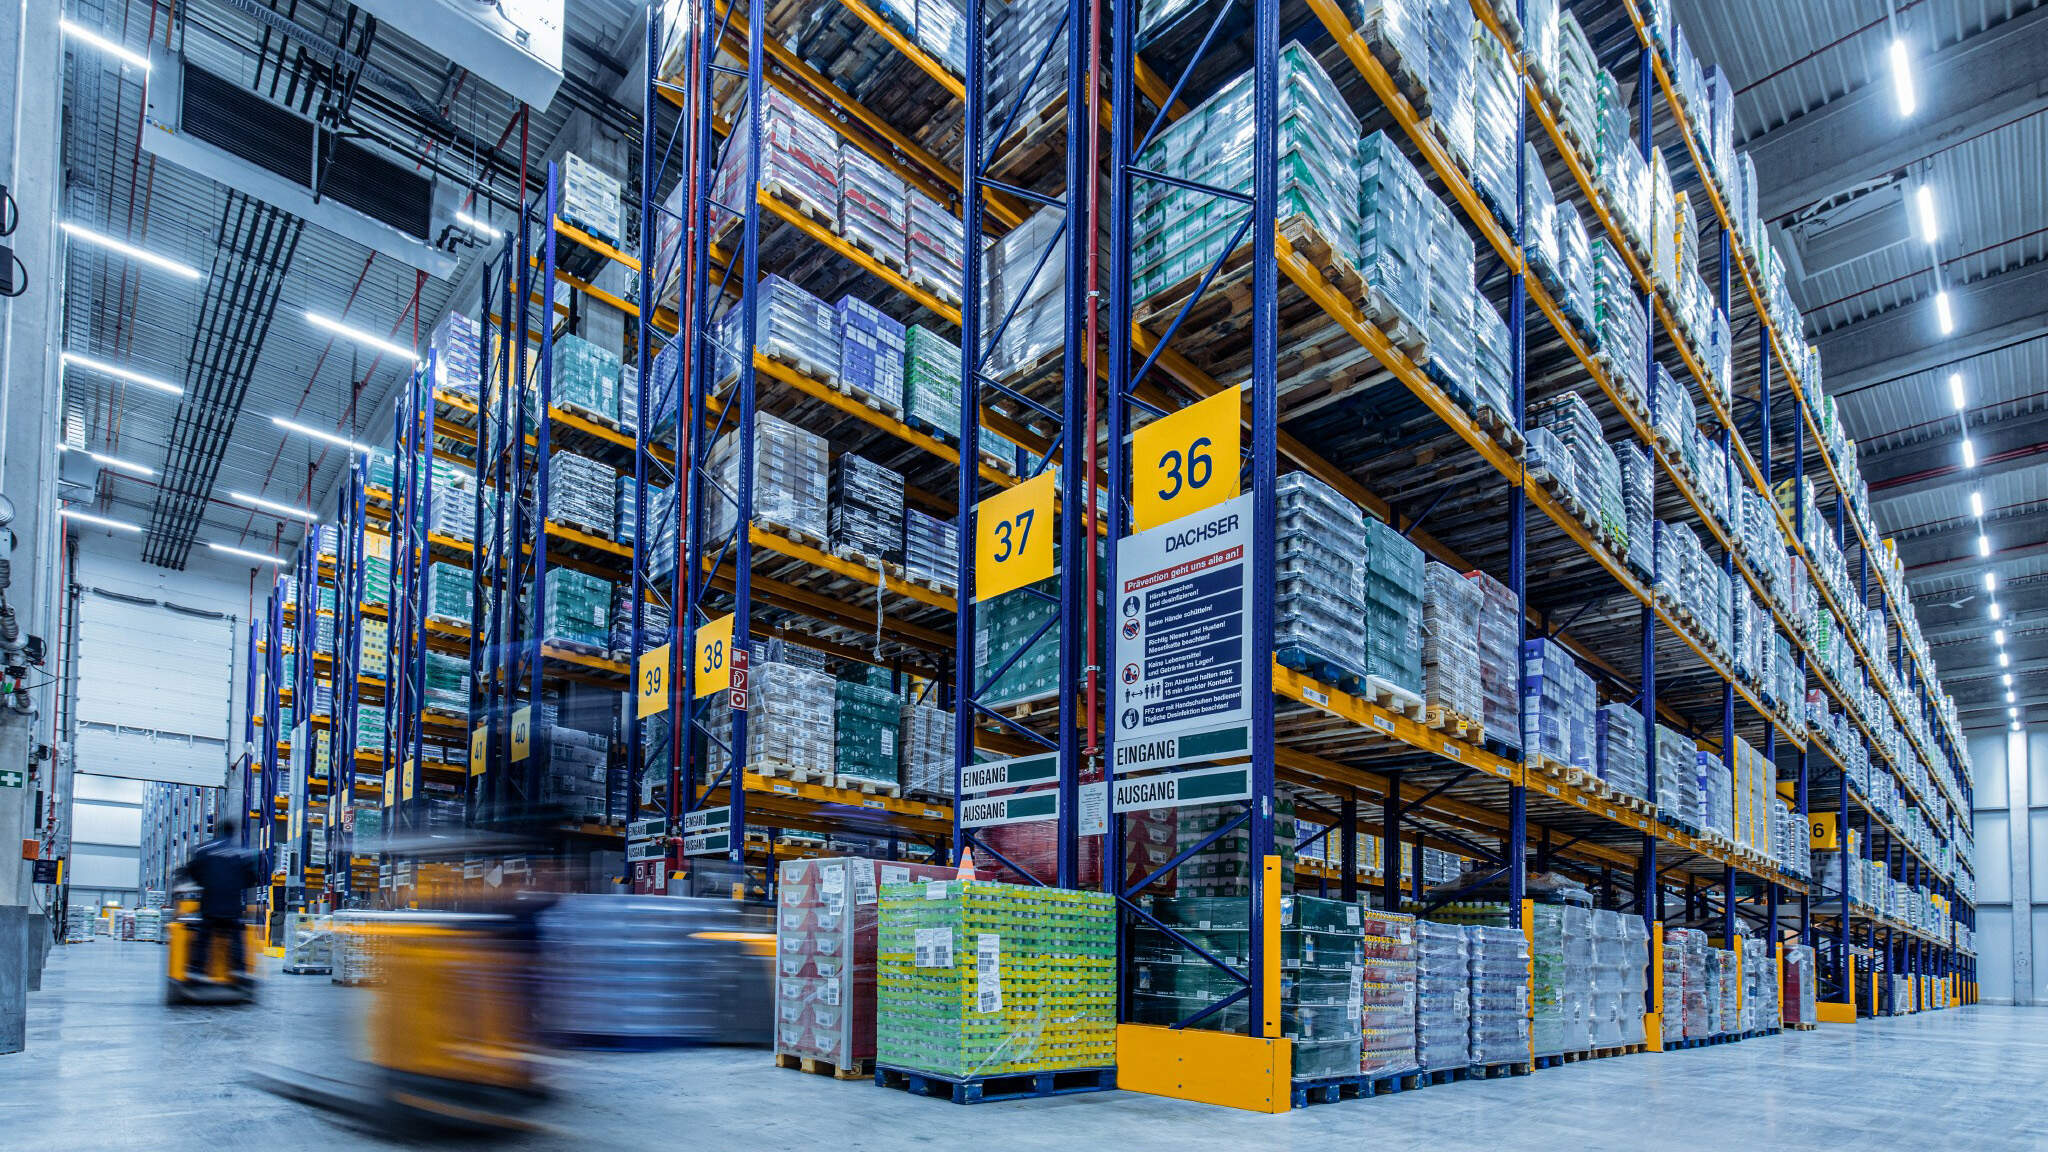
Landside BOH. Everything that supports terminal operations outside the security cordon. Goods inwards docks, central stores, food and beverage consolidation, retail replenishment to landside outlets, waste consolidation, recycling and organics flows, cleaning consumables, linen, ground transport services, and the back-of-terminal logistics for landside concessions. Landside BOH has standard logistics characteristics but with the volume, peak shape, and 24/7 operating rhythm of an airport.
Airside BOH. Everything that crosses the security boundary into the secure zone. In-flight catering trucks, airside F&B outlet replenishment, airside retail (duty-free, news, convenience), lounge supplies, crew supplies, cleaning and consumables, waste being moved off airside, and the supply chains that support ground handling, refuelling, and aircraft turnaround. Every airside-bound item must be security-screened. Every airside operator must hold appropriate ASIC clearance. Every vehicle movement is governed by airside driving authorisations and route control.
Cross-cutting infrastructure. Loading docks (typically multiple, dedicated to landside and airside flows), screening facilities for goods, storage rooms, waste compactors, dock management systems, and the IT and operational systems that govern access, scheduling, and traceability across both zones.
The point of this segmentation is that airport BOH is not one operating model. It is two operating models with a security boundary between them, plus the infrastructure that connects them. Designing the two without recognising they are different operating problems is one of the most common BOH design failures we see across major-venue operations.
Why airport BOH is uniquely complex
Other major venues (stadiums, hospitals, integrated resorts, shopping precincts) all have demanding BOH operating environments. Trace's existing analysis on hospital and stadium BOH covers many of the recurring patterns. Airport BOH differs from all of them on five dimensions.
Security screening of every airside-bound item. Every pallet, every roll cage, every catering trolley crossing the security boundary must be screened. The screening regime has progressively moved from X-ray to 3D CT scanning at major airports for both passenger and goods security, with implications for throughput, layout, equipment, and the timing of deliveries. A screening process that adds even small amounts of cycle time per movement can cascade into significant peak-period congestion.
24/7 operations with concentrated demand peaks. Domestic and international flight schedules produce peaks that are predictable but acute. Catering uplift before international departures, retail replenishment for morning departures, F&B replenishment to support arrival hours, waste flows in the opposite direction. The operating model must absorb the peaks without over-resourcing the trough hours.
Multiple tenants and operators. A typical Australian capital city airport hosts multiple ground handlers, multiple in-flight caterers, multiple retail concessionaires, multiple F&B operators, multiple lounge operators, and multiple cleaning and waste contractors. The airport operator does not directly control most BOH movements. It governs them through tenant agreements, operating protocols, and shared infrastructure.
Airside permits and driving authorisations. Vehicles operating airside must hold appropriate authorisations, follow defined routes, and operate within structured movement protocols. Driver training, ASIC clearance, vehicle compliance, and route adherence all sit inside the BOH operating model.
Cold chain and food safety at scale. International catering uplift involves the largest single cold-chain flows on most airport sites. Cold-chain integrity, food safety compliance, and traceability are non-trivial operational requirements rather than peripheral concerns.
The combined effect is that airport BOH is one of the most demanding operating environments in Australian logistics, and the design discipline required to make it work is correspondingly higher.
The 2026 Australian context: a generational capacity expansion
The current Australian airport capacity expansion programme is the largest the country has seen in a generation. The implications for BOH operating models are material at every airport touched by the programme.
Western Sydney International opens in late 2026 with initial capacity of around 10 million passengers per year and a staged expansion path that ultimately accommodates up to 82 million passengers and four terminals on a 24/7 operating basis. WSI is the first major Australian airport to be designed from a clean sheet in over 50 years. The BOH design choices being embedded today shape the operating model for decades.
Melbourne Airport announced a $4.5 billion terminal expansion in March 2026, including five additional wide-body gates, expanded check-in, security and lounge areas, a new $500 million tote-based baggage handling system increasing capacity to over 4,000 bags per hour, and a planned third runway in 2031. Each expansion phase has corresponding BOH implications: new outlet locations, new airside catering volumes, new screening throughput requirements, new waste flows, and new vehicle movement patterns.
Brisbane Airport is progressing its $5 billion Future BNE transformation across international and domestic terminals, with a third terminal planned.
Perth Airport is delivering the new terminal and runway development reported by the ACCC as part of the $20 billion sector capital programme, with completion timelines extending into 2031.
Sydney Airport has proposed integration of T2 and T3 domestic terminals as part of its programme.
The ACCC has reported that the four largest airports invested $1.5 billion in aeronautical facilities in 2024-25, a 43.6 per cent increase on the prior year, with collective proposed major infrastructure spend approaching $20 billion over the next decade. Almost every project in that pipeline reshapes BOH operations directly or indirectly.
For airport operators, major tenants (airlines, ground handlers, caterers, concessionaires), and the design and construction partners delivering the expansion programme, the BOH operating model is not a peripheral consideration. It is one of the central design questions that determines whether the new infrastructure delivers its operational promise.
The strategic BOH decisions facing operators
Underneath the construction programme, every Australian airport operator now faces a set of strategic BOH decisions. These are not tactical fit-out decisions. They are operating model choices with twenty-year implications.
Centralised versus distributed stores. Concentrating receiving, screening and storage in a single landside facility versus distributing across multiple terminal-adjacent stores. Centralisation reduces footprint and improves screening throughput but increases internal vehicle movements and adds dependency on internal logistics flows. Distribution reduces internal movements but multiplies fixed infrastructure cost. The right answer varies by airport scale, terminal geometry, and tenant mix.
Operator-run versus tenant-managed BOH. How much of the BOH operation the airport operator runs directly versus how much sits with tenants. Catering, retail, F&B, cleaning, and waste are most commonly tenant-managed under operating protocols. The airport operator's role is governance, infrastructure, scheduling, and exception management. The boundary between operator and tenant responsibilities is the most consequential operating model decision in any new terminal project.
Screening capacity and configuration. Whether screening is centralised in a single facility, distributed across multiple dock locations, or implemented in a hybrid model. The cycle time, equipment type (X-ray, 3D CT, EDS for explosives), and operational protocol all interact with the broader BOH flow design. New 3D CT capability adds throughput and reduces secondary inspection rates but requires footprint and capital investment.
Demand modelling and capacity sizing. What level of BOH throughput the operating model is being designed for. This is the area where most BOH design exercises in our experience are weakest.
Technology and digital enablement. Dock booking systems, vehicle access control, security clearance management, waste tracking, F&B replenishment scheduling, and the data layer that allows the airport operator to manage the BOH operating model rather than just observe it.
Sustainability and waste. Waste segregation, organics processing, single-use plastic reduction, packaging reduction, and the broader sustainability agenda all sit inside the BOH operating model. Most Australian airports have material sustainability commitments that depend on BOH design and operating discipline to deliver.
Demand modelling: the most consistently under-done discipline
The most common pattern in major-venue BOH design, and airports in particular, is demand modelling that is too coarse to support sound design decisions. The most frequent failure mode is forecasting BOH demand from passenger volumes alone.
Passenger volume is the headline metric and is usually well-forecast, but it is not the right driver for most BOH demand. The right drivers vary by flow type.
Airside catering demand is driven by international departure schedules, aircraft size mix, sector lengths, and meal service patterns. Not by total passenger numbers.
Retail and F&B replenishment demand is driven by the number, type, size, and location of outlets across the terminal, their hours of operation, and the dwell time patterns of passengers in different terminal zones. Not by total passenger numbers.
Waste demand is driven by the same outlet count, plus front-of-house traffic patterns, plus cleaning shift patterns. Not by total passenger numbers.
Lounge supply demand is driven by lounge count, lounge size, lounge service model (food, drinks, amenities) and operating hours. Not by total passenger numbers.
In every case, forecasting from passenger volume alone produces design estimates that are systematically wrong. Outlet count, outlet mix, outlet operating hours, and the per-outlet demand profile are what drive most BOH flow demand. The dock capacity sized from a passenger-volume forecast often turns out to be undersized or oversized by significant margins.
The right demand modelling discipline starts with the outlet and service inventory, models the per-outlet flow demand, aggregates upward, and stress-tests against peak schedule patterns and growth scenarios. This is structurally different from passenger forecasting. Done properly, it produces design estimates that survive contact with operating reality.
Tenants, concessionaires, and the operating model question
Most airport BOH movements are not generated by the airport operator. They are generated by tenants: airlines, ground handlers, in-flight caterers, retail concessionaires, F&B operators, lounge operators, cleaning contractors, and waste contractors. The airport operator's role is to design the operating environment, govern the protocols, and manage exceptions.
The operating model question is where to set the line between airport operator and tenant responsibility. The choice has commercial, operational, and risk implications.
At one end of the spectrum, the airport operator owns and runs significant BOH infrastructure (loading docks, screening, central stores, internal logistics), with tenants paying for service. This concentrates control and standardises operations but expands the airport operator's operating footprint.
At the other end, tenants run their own BOH operations against operating protocols set by the airport. This minimises the airport operator's footprint but requires sophisticated governance and creates inconsistencies across operators.
Most Australian airports operate a hybrid model. The airport runs shared infrastructure (docks, screening, key internal flows) and governs tenant operations through agreements and protocols. The hybrid model is operationally viable but requires deliberate design.
The single most common BOH operating model failure we see in major-venue work is the absence of clear boundary definition. When the operating model is ambiguous, accountability for exceptions becomes contested, scheduling discipline erodes, and the front-of-house experience suffers.
Workforce, ASIC and the security architecture
Airport BOH workforces sit inside a more demanding security and compliance architecture than most logistics environments. Airside-bound workers, vehicle drivers, screening staff, and stores teams all hold ASIC (Aviation Security Identification Card) or equivalent clearances. Driving authorisations are airside-specific. Training requirements are extensive. Background-checking lead times can be material.
The workforce planning implications are significant.
Recruitment lead times include ASIC clearance, which can take meaningful time depending on the applicant's background. Workforce planning has to absorb the lead time, not be surprised by it.
Retention has commercial value in this environment. A cleared, trained airside worker has higher replacement cost than an equivalent worker in a non-airport setting. Retention discipline matters more.
Contractor management has to maintain visibility of which contractor workers hold which clearances, when those clearances expire, and what training is current. The data discipline is non-trivial.
Peak-period workforce supply is harder to flex than in standard logistics environments because of the clearance requirement. The operating model must build workforce capacity in advance rather than scale reactively.
For more on workforce planning in complex operating environments, our Workforce Planning and Scheduling practice covers the methodology that applies.
Where airport BOH operating models fail
In our experience working with infrastructure operators and major-venue clients across hospitality, healthcare, retail precincts and adjacent sectors, the recurring BOH failure patterns at airports are five.
Demand modelling from passenger volume alone. As covered above. The single most common upstream design error, and the one with the largest downstream cost. Outlet count, outlet mix, and per-outlet demand profile are what should drive most BOH flow estimates, not passenger forecasts.
Under-designed loading dock capacity. Loading docks are usually the binding constraint on landside BOH performance. Under-designed dock capacity shows up as queuing, vehicles waiting on public roads, missed delivery windows, and cascading peak-period failures. Dock capacity design is one of the highest-leverage BOH design decisions.
Ambiguous operator-tenant boundaries. The BOH operating model that does not clearly define operator versus tenant responsibility produces accountability gaps that surface as exceptions and disputes. Clear boundaries from day one are worth significant operating efficiency over the asset life.
Under-resourced screening capacity. Screening throughput is the binding constraint on airside-bound flows. Under-resourced screening cascades into late catering uplifts, missed retail replenishment windows, and operating disruption. The investment in screening capacity is rarely the part of a BOH budget that gets cut without consequence.
Treating BOH as the last design priority. Many major venue projects, airport projects included, treat BOH as the residual design exercise after the front-of-house and architectural decisions have been made. The result is BOH layouts that are technically functional but operationally awkward. Bringing BOH design into the master planning phase alongside front-of-house design is one of the highest-return changes a project can make.
The common thread is treating BOH as an afterthought rather than as a core element of the operating model. The new generation of Australian airport infrastructure projects has the opportunity to do this differently.
How Trace Consultants can help
Trace Consultants advises Australian infrastructure operators, major tenants, and the design and delivery partners working on Australia's major-venue and airport BOH operations. Our positioning is deliberate: senior-led, partner-anchored, vendor-agnostic, with practical operating experience across hospitality, healthcare, infrastructure, and retail BOH environments.
Master planning and BOH design. We work with master planners, architects, infrastructure operators, and project teams to embed BOH design discipline into the master planning phase rather than the fit-out phase. Our Back-of-House Logistics practice covers loading dock design, central stores, internal flows, screening configuration, and the integrated operating model.
Demand modelling for major venue capacity expansion. We build defensible demand models from outlet count, service mix, and per-outlet drivers, stress-tested against schedule patterns and growth scenarios. The deliverable is a working model the project team can use across design decisions, not a single point forecast.
Operating model design and tenant protocol architecture. Where the BOH operating model spans airport operator and tenant responsibilities, we design the operating boundaries, the governance architecture, and the protocols that make the hybrid model work.
Workforce planning and ASIC-cleared workforce design. Our Workforce Planning and Scheduling practice covers the workforce demand modelling, supply analysis, recruitment lead time management, and rostering discipline that the security-cleared workforce environment requires.
Technology and digital enablement. Dock booking systems, vehicle access control, security clearance management, waste tracking, and the broader BOH technology stack sit inside our Technology practice.
Commissioning and operational readiness. Where the BOH design transitions into operational reality, our Project and Change Management practice supports the commissioning, operational readiness, and post-go-live stabilisation work that determines whether the design intent is delivered in operation.
Explore our Back-of-House Logistics services →
Where to begin
If you are an airport operator, a major tenant, or a project team scoping BOH work, start with three questions. What does the demand profile actually look like at the outlet, flow type, and time-of-day level, not at the aggregated passenger volume level? Where are the binding capacity constraints in the BOH operating model today, and where will they be after planned expansion? Where do the operating boundaries sit between airport operator and tenant responsibility, and are they clear enough to govern exceptions?
If those three questions surface material gaps, the next step is a structured BOH operating model review.
Frequently asked questions
What is airport back-of-house logistics? The set of operations that supports passenger-facing airport functions: goods receiving, security screening of airside-bound items, central stores, internal logistics flows, food and beverage replenishment, retail replenishment, in-flight catering, waste flows, lounge supplies, ground handling support, and the operating model that governs all of them across landside and airside zones.
What is the difference between landside and airside BOH? Landside BOH operates outside the security cordon and supports terminal landside functions. Airside BOH crosses into the secure zone and must comply with airside operating protocols, ASIC clearance requirements, and security screening for all goods entering the zone. The two operate as related but distinct operating models.
Why is airport BOH more complex than other major-venue BOH? Five factors: security screening of every airside-bound item, 24/7 operations with concentrated demand peaks, multiple tenants and operators, ASIC clearance and airside driving authorisation requirements, and cold-chain and food safety requirements at significant scale.
What is ASIC clearance? Aviation Security Identification Card, the mandatory background-checked credential required for workers operating in airside zones at Australian airports. Lead times for clearance can be material and must be planned for in workforce supply.
Why should BOH be designed from outlet count rather than passenger volume? Most BOH flow demand is driven by outlet count, outlet mix, operating hours, and per-outlet demand patterns, not by total passenger numbers. Forecasting from passenger volume alone systematically produces design estimates that miss the actual drivers of demand. The right method starts with the outlet and service inventory and models per-outlet flow demand.
What is the typical scale of Australian airport capacity expansion in 2026? The ACCC has reported the four monitored airports (Sydney, Melbourne, Brisbane, Perth) invested $1.5 billion on aeronautical facilities in 2024-25, with collective proposed major infrastructure spend approaching $20 billion over the next decade. Western Sydney International opens in late 2026, Melbourne announced a $4.5 billion expansion in March 2026, and Brisbane is progressing its $5 billion Future BNE programme.
How does 3D CT screening change BOH operations? Three-dimensional computed tomography (3D CT) provides higher-resolution imaging of screened items, generally reducing secondary inspection rates and improving throughput compared with traditional X-ray. The implications for BOH operations include screening capacity sizing, layout, equipment investment, and timing of deliveries.
Who is responsible for BOH operations at an airport: the airport operator or the tenants? Most Australian airports operate a hybrid model. The airport operator runs shared infrastructure (loading docks, screening, key internal flows) and governs tenant operations through operating protocols. Tenants (airlines, caterers, retailers, F&B operators, ground handlers, cleaners, waste contractors) run their own BOH operations against the protocols. The boundary between operator and tenant responsibilities is one of the most consequential operating model decisions in any airport BOH design.
When should BOH design be considered in a major airport project? During master planning, alongside front-of-house design, not during fit-out. Treating BOH as a residual design exercise produces layouts that are technically functional but operationally awkward. The cost of doing BOH design early is small. The cost of doing it late is significant.
What are the most common BOH operating model failures at airports? Demand modelling from passenger volume alone, under-designed loading dock capacity, ambiguous operator-tenant boundaries, under-resourced screening capacity, and treating BOH as the last design priority.
Airport back-of-house operations are the half of the airport business the passenger never sees and the operator cannot afford to get wrong. The current Australian airport capacity expansion programme is the largest in a generation, and the BOH operating model implications of that programme are still being worked through across multiple projects.
If you are scoping a new terminal, expanding existing infrastructure, or running an existing airport BOH operation under capacity pressure, the work starts with the operating model.
Explore our Back-of-House Logistics services →
Related reading: Back-of-House Logistics · Project and Change Management · Workforce Planning and Scheduling · Technology · Strategy and Network Design · Insights


.jpg)