Form Submitted

Thanks for your enquiry, we'll be in touch soon.

We appreciate you taking the time to get in touch. Your message has been received and will be reviewed by a member of the Trace team within 1–2 business days.

While you wait, see what we're all about. Learn more about how Trace works, what sets us apart, and the kinds of problems we help clients solve.

Latest news & Insights

Explore insights from
the Trace team.

Explore our insights to see how we approach real-world complexity with clarity, structure, and measurable outcomes.

Warehousing & Distribution

How to Design a Distribution Centre: A Practical Guide

Tim Fagan
March 2026
Most distribution centre design problems are locked in during the briefing phase, before a single drawing is produced. Here's how to get the process right from the start.

A distribution centre is one of the most capital-intensive and operationally consequential investments a supply chain organisation makes. Get the design right and you have a facility that runs efficiently for 10–15 years, absorbs volume growth without constant disruption, and gives the operation genuine competitive advantage. Get it wrong — and wrong usually means locked-in at the briefing phase, before anyone has started drawing — and you spend the life of the lease working around structural constraints that cost you money every single day.

This article is a practical guide to the DC design process: how to define the brief, how to size the facility, how to make the layout decisions that determine operational performance, how to select the right storage and materials handling systems, and how to manage the design project to avoid the mistakes that consistently derail Australian DC projects.

It is written for supply chain leaders, operations directors, CFOs, and project teams who are facing a new DC build or fit-out decision and want to understand what good looks like — and where the traps are.

Why DC Design Gets Expensive When It Goes Wrong

The consequences of a poorly designed distribution centre are not immediately visible. They accumulate. A receiving dock that is two positions short of what the throughput requires forces operations to manage daily inbound queues. A pick face that was sized for current SKU counts and cannot expand without a racking reconfiguration becomes a constraint within three years of opening. A floor-level mezzanine installed to accommodate manual picking that is later incompatible with the goods-to-person automation the business wants to deploy creates a retrofit problem at seven figures.

None of these are technology failures. They are design failures — specifically, failures to adequately define requirements before the design work began. The brief drives everything. A weak brief produces a facility designed to the wrong parameters, and the cost of correcting that inside a 10-year lease is enormous.

The starting point for any DC design project is therefore not AutoCAD. It is a rigorous requirements definition process that establishes what the facility needs to do — not just today, but across the full lease horizon.

Stage 1: Defining the Brief — The Most Important Document You Will Produce

The design brief is the document that defines what the distribution centre must achieve. Every subsequent design decision — size, layout, storage systems, automation, dock configuration — is derived from the brief. Errors in the brief produce errors in the design that cannot be corrected without starting again.

A complete DC design brief covers the following dimensions:

Throughput requirements. What volumes does the facility need to handle — inbound receipts, outbound despatches, and the peak-to-average ratio that determines how the facility must be sized. Many Australian DCs are designed to average throughput and then struggle operationally during the peaks (promotional periods, seasonal demand, end-of-month retailer orders) that actually determine how the facility needs to function. Size for the operational peak, not the annual average.

Order profile. What does the outbound order look like — pallet orders, carton orders, unit picks, or a mix? The order profile is the single most important determinant of picking system design. A DC despatching 95% full pallet orders needs a completely different pick design from one despatching mixed-carton store replenishment or e-commerce unit picks. Getting this wrong — designing a pick operation for the wrong unit of measure — is one of the most common and costly DC design errors.

SKU profile. How many active SKUs does the facility hold? What is the velocity distribution — what proportion of SKUs are fast-moving (A-class), medium-moving (B-class), and slow-moving (C-class)? What are the physical characteristics — weight, dimensions, fragility, temperature requirements, hazardous materials classification? The SKU profile determines storage system selection, slotting strategy, and the pick face configuration.

Inventory holding requirement. How many days of stock does the facility need to hold? This determines the storage volume requirement — and therefore a significant component of the floor area calculation. Inventory holding requirements are frequently underestimated in DC briefs because the analysis is done at average inventory levels rather than at the maximum holding position the facility must accommodate.

Growth assumption. The facility will serve the business for the duration of the lease — typically 10–15 years for a purpose-built DC. The brief must include a credible view of volume growth over that period, with the design incorporating sufficient flexibility to accommodate that growth without a major reconfiguration. A facility designed for today's throughput with no expansion provision will be operationally constrained within three to five years.

Operating model. How will the facility be staffed and operated? What shift patterns? What degree of automation is being considered — now or in the future? Will the facility operate under a WMS, and if so, which one? The operating model directly affects the physical design: automation infrastructure requirements, power and data provisions, floor flatness specifications, and the spatial requirements for operational support areas.

Special requirements. Temperature-controlled storage (chilled, frozen, ambient-controlled), hazardous materials storage and handling, pharmaceutical serialisation and traceability requirements, bonded storage, returns processing areas, value-added services (pick-and-pack, kitting, labelling). Each of these has specific physical design implications that need to be captured in the brief before the design begins.

Stage 2: Sizing the Facility

With the brief defined, the facility can be sized. DC sizing is an engineering calculation, not an estimate — and the quality of the output depends entirely on the quality of the input data.

The sizing process works through three components:

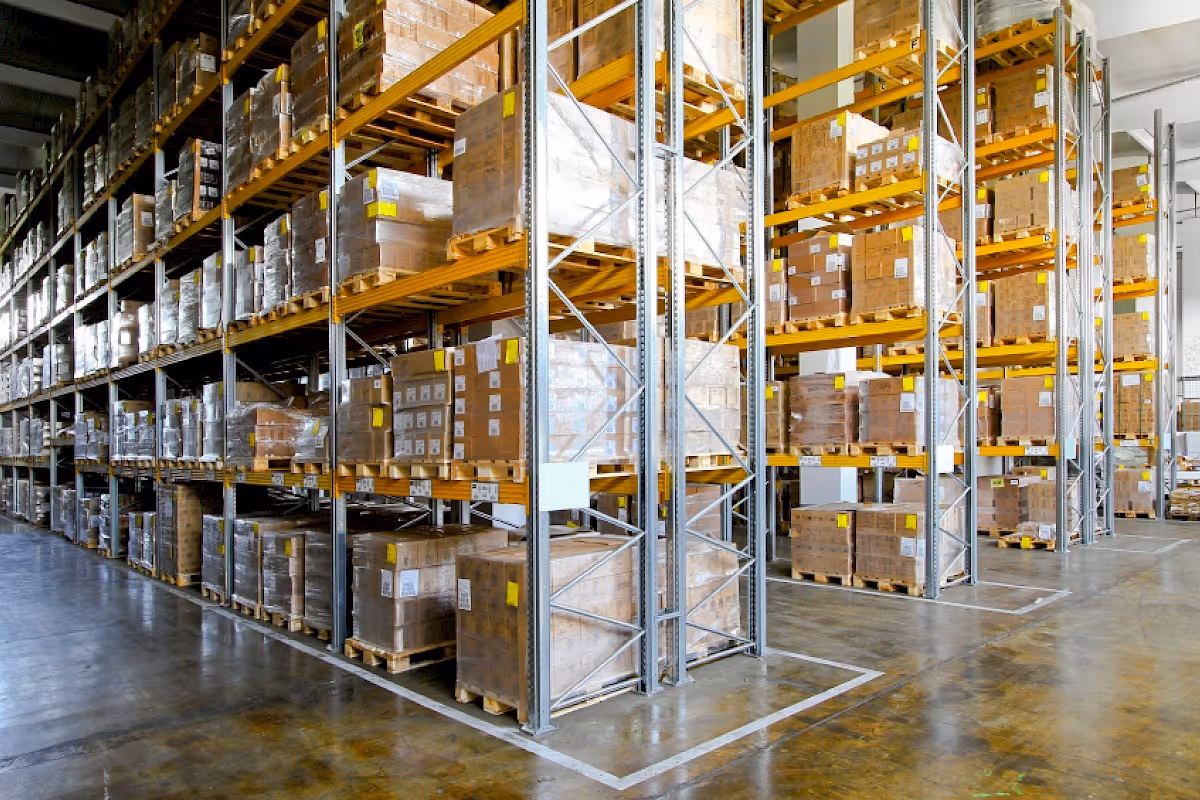
Storage volume calculation. Convert the inventory holding requirement (in units or pallets) into a physical storage volume, accounting for the storage systems being used. Selective racking at 9–10 metres clear height yields a fundamentally different storage density from drive-in racking, narrow-aisle racking, or automated storage. The storage volume calculation also needs to account for the space occupied by aisles, which varies significantly by storage system — selective racking with standard forklifts requires aisle widths of 3.0–3.5 metres; very narrow aisle (VNA) racking with man-up trucks reduces this to 1.6–1.8 metres, increasing storage density by 30–40% at higher capital and operating cost.

Operational area calculation. The non-storage operational areas of the DC — inbound staging and receiving, outbound marshalling and despatch, pick faces, packing benches, value-added services, battery charging, maintenance, waste management, and staff amenities — typically represent 25–35% of total floor area in a well-designed facility. These areas are frequently undersized in initial design briefs because the focus is on storage, and the operational consequences of inadequate staging and marshalling space are only felt once the facility is running.

Dock calculation. The number of inbound and outbound dock doors required is determined by the peak hourly throughput of vehicles, the average turnaround time per dock, and the separation required between inbound and outbound operations. Dock underprovision is a structural constraint that cannot be easily remedied within an existing building — the number of dock positions should be calculated for the peak operational position over the lease horizon, not current average throughput.

The output is a total net internal area (NIA) requirement. To convert this to a gross internal area (GIA) or gross external area, add a structural factor (typically 3–8% for columns, walls, and plant rooms) and confirm against the clear internal height assumption.

In the current Australian industrial property market, where national vacancy rates edged upward through 2024 and into 2025 as new supply entered the market Trace consultants, there is more tenant negotiating leverage than has existed for several years — but lease economics still favour locking in a well-sized facility over signing a lease and then discovering the building is inadequate.

Stage 3: Layout Design — The Four Principles

With the size established, the internal layout can be designed. Four principles govern distribution centre layout, and the best DC designs achieve a well-balanced optimisation across all four simultaneously. Optimising for one at the expense of the others is a common design error.

Flow. Goods should move through the facility in a logical, unidirectional sequence — inbound, storage, pick, pack, despatch — with minimal backtracking and no cross-flow between inbound and outbound traffic streams. The three canonical layout configurations are the I-shape (receive at one end, despatch at the other — maximum separation, maximum hardstand requirement), the U-shape (receive and despatch on the same elevation — most common in Australian conditions, minimises hardstand), and the L-shape (receive and despatch on perpendicular elevations — suits irregular sites). The right choice depends on site geometry, relative volumes of inbound and outbound activity, and the separation requirements of the specific operation.

Accessibility. Every storage location needs to be accessible to the handling equipment used to service it, at the frequency required by the product's velocity. Fast-moving SKUs need pick faces that are immediately accessible, at the right height, without retrieval from depth storage. Slow-moving SKUs can be stored at height or in deep locations where access takes longer. Designing storage accessibility around velocity — putting fast movers closest to the pick despatch point, in the most accessible locations — is the slotting principle that has the greatest impact on pick productivity.

Space utilisation. The cubic volume of the building should be used as efficiently as the handling equipment and storage systems allow. Australian industrial property is expensive; unused cubic volume is wasted capital. The tension is between space utilisation and accessibility — very dense storage systems (drive-in racking, mobile racking, AS/RS) maximise cubic use but constrain access, while wide-aisle selective racking maximises accessibility at the cost of storage density. The right balance depends on the velocity profile: facilities with a high proportion of slow-moving, low-access-frequency SKUs can justify denser storage systems; facilities with high throughput and frequent access requirements need more accessible configurations.

Safety and throughput. The layout must provide clear separation between forklift and pedestrian traffic, adequate sight lines at intersections, sufficient aisle widths for the equipment in use, and compliance with Work Health and Safety legislation and the relevant Australian Standards. Safe design is not a constraint imposed on operational design — it is an integral part of it. Facilities that compromise safety in the pursuit of storage density or throughput create liability and operational disruption that far outweighs any efficiency gain.

Stage 4: Storage System Selection

Storage system selection is one of the most consequential technical decisions in DC design. The wrong system — one that is right for the product range in the brief but wrong for how the range evolves — becomes a stranded asset.

The main storage system options and their appropriate applications:

Selective pallet racking is the most common system in Australian DCs — every pallet position is directly accessible, the system is highly flexible (beam heights can be adjusted, configurations changed), and it suits wide velocity ranges. It is the right default choice for most general merchandise, FMCG, and retail distribution applications. Its limitation is space efficiency: because every pallet position requires its own aisle access, utilisation of the building footprint is lower than denser systems.

Drive-in and drive-through racking sacrifices individual pallet accessibility for density — forklifts drive into the racking structure to place and retrieve pallets in depth. It is appropriate for high-volume, low-SKU-count operations with limited product variability and where FIFO discipline is either not required or can be managed structurally (drive-through for FIFO, drive-in for LIFO). Common in cold storage (where maximising refrigerated volume is paramount) and beverage distribution.

Narrow-aisle and very narrow aisle (VNA) racking reduces aisle widths from the 3.0–3.5 metres required by counterbalance forklifts to 1.6–1.8 metres by using guided turret trucks or man-up order pickers. The density improvement is substantial — 30–40% more pallet positions on the same footprint — at the cost of specialist equipment, higher capital investment, and reduced operational flexibility. It suits operations where land cost is high and the investment in specialist equipment is justified by the density improvement.

Automated Storage and Retrieval Systems (AS/RS) — including stacker cranes, shuttle systems, and goods-to-person systems — deliver the highest storage density and can operate at heights of 30–40 metres. They are increasingly relevant for Australian operations as labour costs rise and automation technology costs fall, but they require significant capital investment, have specific building specification requirements (floor flatness, seismic considerations, sprinkler system design), and are most appropriate for operations with the throughput to justify the investment. The business case is strongest for operations with high SKU counts, significant slow-moving stock, or strong labour cost pressure.

Mezzanine and multi-level picking suits operations with high unit-pick requirements — e-commerce fulfilment, pharmaceutical distribution, and parts distribution. Mezzanines add effective floor area within the building height, supporting manual or semi-automated pick operations across multiple levels. They require careful structural design and fire engineering, and the decision to install mezzanine structure needs to be made early in the design process, as retrofitting is expensive.

Stage 5: Dock and Yard Design

The dock and yard are frequently the most undersized elements of Australian DC designs — because they are the least visible in a building floorplan but among the most operationally critical.

Dock door quantity should be sized for the peak inbound and outbound vehicle arrival rate, with separate dock zones for inbound and outbound to avoid cross-contamination of receiving and despatch operations. Dock levellers, dock seals, and vehicle restraints are standard equipment in a well-equipped Australian DC — not optional additions.

Yard design needs to accommodate the full length of B-double or road train vehicles where applicable, provide adequate turning radii, separate truck movements from staff car parking, and manage the queue of vehicles waiting for dock allocation during peak periods. Yards that are too small to accommodate the vehicle mix that actually arrives at the facility — a common problem when the brief was written assuming semi-trailers and the customer shifts to B-doubles — create serious operational bottlenecks and safety risks.

Container unloading areas, wash-down bays, waste management areas, and trailer parking for pre-loaded or pre-staged vehicles all need to be designed into the yard from the outset.

The Australian Context: Specific Design Considerations

Several factors make DC design in Australia distinct from the generic principles in international reference material.

Industrial property constraints. The Australian industrial property market is dominated by institutional landlords — GPT, Goodman, Charter Hall, Logos, CEVA — with standard speculative DC products in the 10,000–50,000 sqm range concentrated in established logistics precincts in western Sydney, the Melbourne west (Laverton, Truganina, Dandenong), Brisbane's Trade Coast and southern corridor, and Perth's Kewdale and Hazelmere precincts. Most Australian occupiers take existing buildings rather than building to suit, which means fitting the design to the building rather than designing the building from scratch. This requires a different approach: the brief must be defined first, the building found second, and the fit-out designed to the specific building's structural parameters — clear height, column grid, dock positions, yard depth, and power supply.

Clear height. Australian speculative DC buildings are now typically built to 12–14 metres clear internal height, with some premium logistics facilities at 15–17 metres. This is substantially higher than the 9–10 metre facilities that dominated the market until the mid-2010s, and it opens up storage system options — particularly high-bay racking and AS/RS — that were not practically available to most occupiers previously.

Labour market. Warehouse labour is structurally scarce and expensive in Australian gateway cities. This shifts the automation business case: the threshold throughput at which automated picking systems are financially justified is lower in Australia than in comparable international markets, because the labour cost it displaces is higher. DC designs that do not at minimum provision for future automation — power supply, floor flatness, structural clearances — are foreclosing options that may become economically necessary within the lease term.

Fire engineering and sprinkler design. Australian Standards AS 2118 and the requirements of AFSS (Automatic Fire Suppression Systems) significantly affect racking height and configuration in Australian DCs, particularly for FMCG, plastics, and high-bay applications. Early engagement with fire engineers during the design process — before racking design is finalised — avoids costly late-stage redesign.

How Trace Consultants Can Help

At Trace Consultants, DC design advisory is part of our Warehousing & Distribution practice. We help Australian organisations define their DC requirements, assess building options against those requirements, design the internal layout and storage system configuration, develop the automation business case, and manage the design and fit-out project.

Our approach bridges the gap between property and operations — we understand both the industrial property market and the operational requirements of a well-run distribution centre, and we design facilities that work as operations rather than as impressive buildings. We also integrate Supply Chain Network Design thinking into DC projects, ensuring facility-level decisions are consistent with the network strategy rather than made in isolation.

We work across FMCG and manufacturing, retail, health and aged care, and government and defence. DC design requirements differ significantly across sectors — the design brief for a pharmaceutical cold chain DC is fundamentally different from a general merchandise retail DC — and that sector knowledge shapes every stage of the process.

Explore our Warehousing & Distribution capability →

Speak to an expert at Trace →

The Brief Is the Design

Every structural problem in a running distribution centre can be traced back to something that was either missing from the brief or inadequately defined in it. Peak throughput not modelled. Growth not provided for. Order profile assumed rather than analysed. Dock positions sized for today's vehicle mix, not tomorrow's.

The investment in getting the brief right — rigorous data analysis, honest operational forecasting, proper stakeholder engagement — is trivial compared to the cost of operating a constrained facility for a decade. The brief is the design. Everything else is implementation.

Explore our Warehousing & Distribution capability →

Speak to an expert at Trace →

What Is a Warehouse Management System and Do You Need One?

Most warehouses that struggle with accuracy, productivity, or visibility problems are running without a WMS — or with one that is poorly implemented. Here's what a WMS actually does and whether you need one.

Warehouse Management Systems are one of the most impactful technology investments an Australian distribution or logistics operation can make. They are also one of the most commonly misunderstood, oversold, and poorly implemented.

The promise is real: a well-selected and properly implemented WMS eliminates manual processes, gives real-time inventory visibility, improves pick accuracy, increases labour productivity, and produces the operational data needed to manage a warehouse as a precision operation rather than a controlled guess. Organisations that implement WMS well consistently report meaningful improvements across throughput, accuracy, and cost per unit handled.

The reality is that WMS implementations fail — or underdeliver — at a rate that should give any prospective buyer pause. The failures are rarely caused by the technology itself. They are caused by poor requirements definition, inadequate business process redesign, underestimated change management, and the chronic Australian problem of selecting a system that is right for the vendor's demo but wrong for the operation.

This article explains what a WMS is, what it does, how to know whether you need one, and how to approach selection and implementation in a way that captures the value.

What a Warehouse Management System Actually Does

A WMS is software that manages and optimises the physical operations of a warehouse or distribution centre — from the moment goods arrive at the inbound dock to the moment they leave on an outbound vehicle, and everything in between.

At its core, a WMS does three things: it tells workers what to do and when, it records what was done and where goods are at every point in the process, and it uses that data to optimise how work is sequenced and resources are deployed.

The specific functional domains a WMS covers typically include:

Inbound and receiving. Managing the receipt of goods against purchase orders or advance shipping notices, directing putaway to optimised storage locations based on product characteristics, velocity, and available space, and recording the exact location of every SKU in the facility.

Inventory management. Maintaining a real-time, location-level inventory record — knowing not just that 500 units of a product are in the building, but exactly which locations they are in, in which batch or lot, and what their status is. This is the foundation that makes everything else in the WMS work.

Picking and order fulfilment. Generating optimised pick lists for outbound orders, directing pickers via the most efficient path through the facility (zone picking, wave picking, batch picking, or cluster picking depending on the operation), and confirming each pick at the point of execution via barcode scanning, voice, or RF technology.

Packing and despatch. Managing the packing process, generating shipping labels and documentation, and confirming outbound loads against manifests.

Labour management. Tracking workforce productivity at the task and individual level — how many picks per hour, putaway rate, receiving throughput — and generating data for performance management, staffing forecasting, and incentive calculation.

Reporting and analytics. Providing operational KPI dashboards, exception reporting, and the transactional data needed to identify bottlenecks, measure performance trends, and support continuous improvement.

Most modern WMS platforms also integrate with adjacent systems: ERPs (for order data, inventory valuation, and financial reconciliation), Transport Management Systems (for carrier booking and dispatch optimisation), Warehouse Control Systems (for automation equipment like conveyors, sorters, and AS/RS), and e-commerce platforms (for order management and customer-facing order status).

WMS vs. ERP Inventory Module: The Important Distinction

One of the most common questions Australian businesses face is whether they need a dedicated WMS or whether their existing ERP's inventory module is sufficient. This is worth answering directly.

ERP inventory modules are designed to track what is in the warehouse — quantities on hand, reorder points, and financial valuation. They are transactional systems: they record that a pick happened, not how it was done, in what sequence, by which worker, or from which location within a storage row.

A WMS is an operational execution system. It directs work at the task level, manages location-level inventory rather than just facility-level, optimises pick paths, manages labour in real time, and generates the operational granularity needed to run a high-throughput facility efficiently.

The distinction matters most as operational complexity increases. For a small, simple operation — a single facility, limited SKU range, low throughput, no advanced fulfilment requirements — an ERP inventory module may be adequate. For operations with high throughput, complex pick requirements, multiple storage zones, labour management needs, or automation integration, an ERP alone will not deliver what is required.

The test is not size — it is complexity and performance gap. A small 3PL with 5,000 SKUs and multi-client billing requirements needs a WMS. A large internal distribution centre moving mostly full pallets of a narrow SKU range may not.

Do You Need a WMS? The Diagnostic Questions

Before committing to a WMS selection and implementation, answer these questions honestly. The pattern of answers determines whether the investment is warranted.

Are you experiencing inventory accuracy problems? Discrepancies between system stock and physical stock, cycle count variances above 1–2%, or frequent stockout surprises despite positive system inventory are classic indicators that location-level inventory management — the core function of a WMS — is missing or inadequate.

Is pick accuracy a persistent issue? Mispick rates above 0.5–1% of lines, customer complaints about incorrect orders, and significant time spent on returns and corrections all indicate that the current picking process lacks the directed execution and confirmation scanning that a WMS provides.

Is labour productivity difficult to measure or improve? If you cannot answer with confidence what your picks-per-hour rate is, how it varies by shift or by worker, or what your labour cost per unit despatched is, you lack the operational data infrastructure to manage labour effectively. A WMS provides that data.

Are you managing multiple channels with different fulfilment requirements? Businesses fulfilling orders across retail replenishment, e-commerce, B2B wholesale, and third-party logistics simultaneously have fulfilment complexity that manual or ERP-only systems handle poorly. A WMS manages the prioritisation, wave planning, and process differentiation that multi-channel fulfilment requires.

Are you planning automation investment? Any significant automation investment — conveyors, sorters, goods-to-person systems, automated storage and retrieval — requires a WMS to direct and control it. The automation cannot function without the WMS providing real-time task instructions and inventory location data.

Is throughput growth outpacing current process capability? If volume is growing and the current operation is absorbing it through headcount rather than productivity improvement, the operation is scaling cost rather than capability. A WMS enables productivity improvement that reduces the marginal cost of additional throughput.

If the answers to three or more of these questions point to significant gaps, a WMS investment is likely warranted and the business case will be achievable.

The Australian WMS Market: What to Know Before You Start

The WMS market in Australia has matured considerably and now offers options across a wide range of scale, capability, and cost. Understanding the market structure helps avoid two common mistakes: over-specifying a system the operation cannot absorb, and under-specifying a system that will be outgrown within two years.

Tier 1 enterprise WMS platforms — Manhattan Associates, Blue Yonder (formerly JDA), SAP EWM, Oracle WMS — are designed for large, complex, high-throughput operations, often with significant automation integration and multi-site requirements. They are powerful, highly configurable, and expensive: implementation costs in the $2–5M+ range are not uncommon, and total cost of ownership over five years routinely exceeds $5–8M for large deployments. They are appropriate for large national retailers, major 3PLs, and FMCG manufacturers with complex distribution networks. They are not appropriate for mid-sized Australian businesses.

Tier 2 mid-market WMS platforms — HighJump (now Korber), Infor WMS, Microlistics, and a range of Australian-developed systems including SEQOS, WISE, PULSE, and TBO4 from The RIC Group — offer strong functional depth at a fraction of the enterprise cost. Implementation in the $200K–$800K range is typical, with annual support costs of $50K–$150K. These systems handle most of the operational complexity that mid-sized Australian distributors, retailers, and 3PLs encounter, and the Australian-developed options benefit from local support, knowledge of Australian operational conditions, and implementation teams that do not require international travel.

Cloud-based and SME-focused WMS — platforms like Fishbowl, Cin7, and NetSuite WMS — are appropriate for smaller operations with limited complexity. They are faster to implement and lower cost, but have functional constraints that make them unsuitable for high-throughput, multi-zone, or automation-integrated operations.

ERP-embedded WMS modules — SAP EWM (embedded within S/4HANA), Microsoft Dynamics 365 WMS, and MYOB Acumatica — are attractive for businesses already on those ERP platforms because they reduce integration complexity. The trade-off is that ERP-embedded WMS typically lags behind best-of-breed WMS in operational sophistication, particularly for complex picking logic and labour management.

The Selection Process: How to Choose the Right System

WMS selection is a procurement and design exercise, not a vendor pitch evaluation. Organisations that approach it as the latter — evaluating vendors based on demos without first defining requirements — consistently make suboptimal choices.

Step 1: Define your requirements before engaging vendors. Document current operational processes, current performance metrics, current pain points, and the specific capabilities the new system must provide. Distinguish must-haves from nice-to-haves. Identify integration requirements (what systems must the WMS connect to, and what data must flow between them). Define the scale parameters: current throughput, projected throughput at three to five years, SKU count, channel mix, and site configuration.

Step 2: Develop a structured RFP. Issue a requirements-based RFP to a shortlist of five to eight vendors — covering functional requirements, technical architecture, integration approach, implementation methodology, support model, and commercial terms. A well-structured RFP produces comparable responses and surfaces the vendors whose systems genuinely match the requirements from those whose demos look impressive but whose systems do not fit.

Step 3: Conduct structured demonstrations against scripted scenarios. Generic demos show what the system can do in ideal conditions. Scripted demonstrations — where each vendor walks through your specific processes using your data — reveal how the system handles your operational reality, including exceptions, edge cases, and the workflows that are genuinely complex in your operation.

Step 4: Conduct reference checks with comparable operations. Speaking to Australian operations of similar size, sector, and complexity that have implemented the shortlisted system in the past two to three years is the most reliable due diligence available. Ask specifically about implementation experience, go-live stability, support responsiveness, and whether the system is actually being used as intended.

Step 5: Evaluate total cost of ownership, not just licence cost. The licence or SaaS cost is typically a fraction of the total cost. Implementation services, hardware (scanning devices, printers, mobile computers), internal project resource, training, parallel running costs, integration development, and annual support add substantially to the total. Comparing systems on licence cost alone produces decisions that are surprised by the actual investment.

Implementation: Where Value Is Made or Lost

The selection decision determines the ceiling of what is possible. Implementation determines whether the operation reaches it.

The most common implementation failure mode is treating WMS go-live as the finish line rather than the starting point. Organisations that invest in requirements definition and system selection but cut corners on process redesign, change management, and post-go-live stabilisation consistently report that the system underdelivers — not because the technology is inadequate, but because it was not properly embedded into the operation.

Key implementation disciplines that determine outcomes:

Process redesign before configuration. A WMS should be configured to support well-designed processes, not to replicate the existing manual processes digitally. The pre-implementation period is the best opportunity to redesign receiving, putaway, picking, and despatch processes — eliminating waste and inefficiency before embedding them in the system. Organisations that skip this step implement a digital version of their current inefficiencies.

Data migration quality. The WMS is only as good as the data it holds. Inaccurate inventory data, missing product master records, incorrect storage location configurations, and incomplete integration mappings will all surface at go-live. Data migration and validation needs to be treated as a project in its own right, not an afterthought.

Staff training and change management. Warehouse staff adopting a WMS are changing their working practice fundamentally — moving from paper-based or memory-based picking to directed, scan-confirmed task execution. This is a significant change that requires adequate training time, floor-level support during go-live, and ongoing coaching. Operations that underinvest in training report the highest rates of system workaround and user resistance.

Phased go-live where feasible. For large or complex operations, a phased approach — implementing the system for a subset of products, zones, or processes before extending to the full operation — reduces go-live risk and creates an opportunity to stabilise before scaling.

Typical Returns on a Well-Implemented WMS

The business case for WMS investment, when correctly calculated, is typically strong. The specific returns vary by operation, but the value drivers are consistent:

Inventory accuracy improvement from 85–92% (typical manual operation) to 98–99.5% reduces stockouts, improves customer service, and eliminates the labour cost of investigation and correction.

Pick accuracy improvement from 98–99% to 99.8–99.95% of lines reduces returns processing, customer credit claims, and the rework cost of mispicks.

Labour productivity improvement of 15–25% through optimised pick paths, directed task execution, and elimination of unproductive time — the single largest value driver in most implementations.

Throughput capacity increase without proportional headcount increase — enabling volume growth to be absorbed through productivity rather than labour cost.

Management visibility and decision-making — real-time operational data that enables proactive management rather than end-of-shift or end-of-week review.

A mid-sized Australian distribution operation handling $300–500M in product throughput annually can typically achieve a WMS return on investment within two to three years of go-live, with ongoing productivity and accuracy benefits that compound over the system life.

How Trace Consultants Can Help

At Trace Consultants, WMS selection and implementation advisory is part of our Technology and Warehousing & Distribution practice. We help Australian organisations define their WMS requirements, structure and run the selection process, evaluate vendor responses, and manage the implementation programme — bringing the operational and commercial knowledge that pure technology consultants typically lack.

Our approach is vendor-neutral: we do not have preferred vendor relationships or implementation revenue from WMS providers. Our interest is in our clients selecting the system that is right for their operation and implementing it in a way that delivers the expected return.

We work across FMCG and manufacturing, retail and e-commerce, health and aged care, and property and hospitality — sectors where the warehousing and distribution challenge varies significantly in character, and where sector knowledge shapes both the requirements definition and the vendor shortlist.

Explore our Warehousing & Distribution capability →

Speak to an expert at Trace →

The Decision in Summary

A WMS is not the right investment for every Australian warehouse operation. For simple, low-throughput, narrow-SKU operations where inventory accuracy is adequate and volume growth is modest, the investment may not be justified.

For operations where accuracy, productivity, channel complexity, or growth are generating genuine operational and commercial problems — and that is most distribution operations above a certain scale — a WMS is one of the highest-return operational investments available. The question is not whether to invest, but how to select and implement in a way that captures the full value.

Get the selection right. Get the implementation right. The returns follow.

Explore our Warehousing & Distribution capability →

Speak to an expert at Trace →

Procurement

How to Reduce Procurement Maverick Spend

Mathew Tolley
March 2026
Every time someone in your organisation buys something outside an approved channel or contract, you lose money. Here's how Australian organisations identify, measure, and systematically reduce maverick spend.

How to Reduce Procurement Maverick Spend in Australia

Every Australian organisation with a procurement function has a maverick spend problem. Most of them do not know how large it is.

Maverick spend — purchasing that occurs outside approved channels, preferred supplier agreements, or established procurement processes — is one of the most persistent and quietly expensive problems in procurement. It is persistent because it is driven by structural and behavioural factors that do not resolve themselves. It is expensive because the costs compound: not just the premium paid on individual off-contract purchases, but the erosion of volume commitments that underpin negotiated pricing, the compliance and risk exposure that unmanaged supplier relationships create, and the procurement capacity consumed managing unauthorised transactions that should never have occurred.

Maverick spend costs organisations 5–16% of negotiated savings annually. SUPLARI For an organisation managing $200M in external spend that has negotiated 10% in savings through strategic sourcing, maverick spend at the lower end of that range is eroding $1–3M of those savings every year — silently, without appearing in any procurement performance report.

This article explains what maverick spend is, what drives it, how to measure it, and how to reduce it in a way that is sustainable — without building a procurement function that the business works around rather than with.

What Maverick Spend Is — and What It Is Not

Maverick spend is sometimes used as a catch-all for any purchasing the procurement team does not like. That framing is both imprecise and counterproductive — it conflates different problems that require different solutions, and it positions procurement as an authority function rather than a value-creation one.

A more useful definition: maverick spend is purchasing that bypasses established procurement governance — approved supplier lists, contracted terms, purchase order processes, or delegation of authority frameworks — in a way that creates cost, compliance, or risk consequences for the organisation.

It is worth distinguishing maverick spend from two related concepts that are often confused with it:

Tail spend is low-value, high-transaction-volume purchasing — the long tail of spend categories that individually represent small amounts but collectively account for a significant share of transaction volume. Tail spend is not inherently maverick; it becomes a problem when it is unmanaged. Much of the solution to tail spend is structural (procurement catalogues, corporate card programmes, simplified approval processes for low-value items) rather than compliance-focused.

Uncontracted spend is purchasing in categories that procurement has not yet addressed through a sourcing process — not because the buyer is bypassing a contract, but because no contract exists. This is a gap in procurement coverage, not a behavioural compliance issue. The solution is to extend procurement coverage to those categories, not to treat the buyer as non-compliant.

Maverick spend in the strict sense is purchasing that bypasses governance that exists and applies. That distinction matters because it determines the right intervention: structural fixes for tail spend and coverage gaps, behavioural and governance interventions for genuine maverick spend.

What Maverick Spend Actually Looks Like

Maverick spend manifests in several distinct patterns, each with slightly different causes and solutions.

Off-contract purchasing from non-approved suppliers. A manager engages a supplier that is not on the approved vendor list — because they have an existing relationship, because the approved supplier is perceived as slow or difficult, or because they do not know the approved supplier exists. The purchase may be perfectly reasonable on its own terms; the problem is that it fragments volume away from contracted suppliers, undermines the commercial terms those contracts are based on, and creates an unmanaged supplier relationship with no performance or compliance oversight.

Bypassing the purchase order process. Goods or services are received and invoiced before a purchase order has been raised — or never go through a PO at all. This is sometimes called "invoice before PO" or "three-way match failure." It is common in operational environments where managers are prioritising speed over process, and in organisations where the P2P process is perceived as burdensome for low-value purchases. The financial consequence is that the spend is invisible to procurement until the invoice arrives.

Non-preferred supplier selection within a category under contract. The organisation has a preferred supplier agreement for a category, but individual purchasers use alternative suppliers within the same category — either because they do not know about the preferred arrangement, because the preferred supplier is not meeting their needs, or because the category contract does not adequately cover their specific requirements. This is the subtlest form of maverick spend and the hardest to detect without good spend data.

Specification drift and non-standard purchasing. Purchasers buy variants or specifications that are not covered by contracted arrangements — often because the specifications in the contract do not match operational requirements, or because individual managers have preferences for specific products or brands that fall outside the contracted range.

Why Maverick Spend Happens: The Root Causes

Treating maverick spend primarily as a behavioural problem — people not following the rules — misdiagnoses the issue and leads to solutions (more policy, more enforcement) that do not work. The evidence consistently shows that maverick spend is driven primarily by structural factors, not by deliberate non-compliance.

Procurement processes are too slow or complex for the purchase at hand. When a manager needs something urgently and the procurement approval process takes two weeks, they will find a faster route. When a low-value purchase requires the same approval process as a $500K contract, the process is disproportionate to the risk. Procurement processes that are not calibrated to the size and urgency of different purchases create systematic incentives for workarounds.

Approved supplier lists are incomplete or inaccessible. If operational managers do not know who the approved suppliers are — because the approved vendor list is not published, not up to date, or not easily accessible from the purchasing system — they will default to suppliers they already know. The problem is not non-compliance; it is that the approved pathway is not clear enough to follow.

Contracted suppliers are not meeting operational needs. When approved suppliers consistently underperform on lead times, product range, service quality, or responsiveness, buyers will look elsewhere. This is rational behaviour. If procurement's response is to enforce compliance with a supplier that is failing, it will lose the business's confidence. The right response is to fix the supplier performance problem.

Decentralised purchasing authority without category governance. When individual business units, cost centres, or sites have purchasing authority and no overarching category strategy, each makes its own supplier selections. The aggregate result is a fragmented, unmanaged supplier base — not because anyone intended it, but because there was no structure to prevent it.

No visibility into the problem. Many organisations do not measure maverick spend. They have no systematic way of identifying off-contract purchasing, no purchase price variance tracking, and no spend analytics that flags non-approved supplier transactions. Without visibility, there is no feedback loop — purchasers do not know their behaviour is a problem, and procurement cannot intervene.

Measuring Maverick Spend

The starting point for any reduction programme is measurement: understanding the current scale of the problem, where it is concentrated, and what it is costing.

Maverick spend measurement requires spend analysis — the same analytical foundation that underpins strategic sourcing and supplier rationalisation. The specific metrics that quantify maverick spend include:

Purchase order coverage rate. What percentage of total spend is covered by a purchase order that was raised before the invoice? Low PO coverage is a direct proxy for off-process purchasing. World-class procurement organisations target PO coverage above 90% for non-tail spend. Many Australian organisations, when they first measure it, find PO coverage in the 60–75% range.

Preferred supplier compliance rate. For categories with contracted preferred supplier arrangements, what percentage of spend in that category goes to preferred suppliers? Compliance rates below 80–85% indicate significant off-contract purchasing. Rates below 70% suggest either that the contract is not meeting operational needs, or that contract awareness is low.

Supplier count relative to spend. A high number of active suppliers relative to total spend is a strong signal of maverick spend — it indicates that purchasing is fragmented across many suppliers, most of which have not been through a sourcing process. As a rough benchmark, an organisation with $100M in indirect spend should be actively transacting with considerably fewer than 500 suppliers if procurement is functioning well.

Purchase price variance. Comparing the actual price paid for goods and services against contracted rates reveals where off-contract purchasing is occurring and what premium is being paid. Systematic positive PPV — paying more than contracted prices — is a direct financial measure of maverick spend cost.

The Six-Lever Reduction Programme

Reducing maverick spend requires addressing its root causes, not just enforcing compliance. The most effective programmes work across six levers simultaneously.

Lever 1: Make the Approved Path Easier Than the Alternative

The single most effective lever for reducing maverick spend is making the compliant purchasing path more convenient than the non-compliant one. This means: a searchable, up-to-date approved supplier catalogue accessible from the purchasing system; simplified approval workflows for low-value purchases (one-click approval below $500, automated below $200); clear guidance on which suppliers to use for common categories; and a responsive procurement helpdesk that resolves category queries quickly enough that buyers do not default to their own solutions.

If the procurement process is harder to use than simply calling a supplier directly, buyers will call the supplier directly. The answer is not more enforcement — it is a better process.

Lever 2: Calibrate Governance to Risk

Most organisations apply the same procurement process to a $50,000 IT services engagement and a $500 catering order. This is both inefficient and counterproductive: it creates friction on low-risk purchases that drives workarounds, while consuming procurement capacity on transactions that do not warrant it.

A tiered governance model — in which approval requirements, sourcing process obligations, and contract requirements scale with the value and risk of the purchase — reduces friction on low-value items while maintaining rigour on material ones. Common thresholds in Australian organisations range from simplified self-approval for purchases below $1,000–$2,000, through manager approval for $2,000–$20,000, to procurement involvement above $20,000 and formal sourcing for categories above $100,000–$250,000. The right thresholds depend on the organisation's spend profile and risk appetite.

Lever 3: Fix the Suppliers, Not Just the Behaviour

Where maverick spend is concentrated in categories where preferred suppliers exist but are underused, investigate why. In many cases, the preferred supplier is not meeting the operational requirements that drove the off-contract behaviour. Fixing that supplier performance problem — through active contract management, KPI reviews, or a resourcing event if the supplier cannot improve — will reduce maverick spend more effectively than compliance enforcement.

Lever 4: Extend Contract Coverage to High-Maverick Categories

Many categories generate maverick spend not because buyers are bypassing contracts, but because contracts do not exist. Identifying the categories with the highest off-contract spend and sequencing them into a sourcing programme directly reduces maverick spend by creating the compliant pathway that currently does not exist. This is the structural fix for uncontracted spend.

Lever 5: Build Spend Visibility and Reporting

Maverick spend that is not visible cannot be managed. Building the reporting infrastructure to track PO coverage by business unit, preferred supplier compliance by category, and purchase price variance by supplier gives procurement the data needed to identify problems, target interventions, and demonstrate improvement.

Regular reporting of these metrics to business unit leaders — not just to procurement — creates accountability. When a business unit head can see that their team's PO coverage is 62% against an organisational target of 90%, that is a management conversation. When it is only visible inside the procurement team, it is a procurement problem.

Lever 6: Engage, Don't Enforce

The least effective approach to maverick spend reduction is a compliance crackdown without accompanying process improvement. Sending emails reminding people to follow procurement policy, threatening consequences for off-contract purchasing, or adding approval steps to existing processes — without making the compliant path easier — typically produces short-term compliance improvement followed by creative workarounds.

Engagement works better: making sure business unit leaders understand why procurement compliance matters (the direct cost to their budgets of off-contract purchasing, not just to the organisation in the abstract), involving them in designing the supplier panels and processes for their categories, and recognising teams that improve their compliance metrics. Procurement that behaves as a business partner rather than a compliance function gets better outcomes — because buyers choose to use it rather than work around it.

The Australian Context: Specific Pressure Points

Several factors make maverick spend a particularly persistent challenge for Australian organisations.

Geographic complexity. Multi-site organisations operating across large distances — national retailers, health networks, mining and resources companies, government agencies with regional offices — face structural challenges in enforcing centralised supplier arrangements. A preferred supplier that is strong in Melbourne and Sydney may have inconsistent service quality in regional Queensland or Western Australia, creating legitimate operational reasons for local workarounds.

Operational urgency in time-critical sectors. Sectors like hospitality, health, manufacturing, and construction have genuine operational urgencies — a kitchen running out of a critical ingredient, a facility requiring urgent maintenance, a production line needing immediate spare parts — where the cost of following a two-day procurement approval process exceeds the cost of the off-contract purchase. Procurement governance in these sectors needs to be designed with operational realities in mind, not just theoretical best practice.

Procurement maturity gaps. Many Australian organisations, particularly in the mid-market and in sectors that have not historically had strong procurement functions, are in the early stages of building procurement capability. In these organisations, approved supplier lists are incomplete, contract coverage is partial, and procurement processes are not yet embedded in operational behaviour. Maverick spend reduction in this context is about building the foundation, not enforcing compliance with a system that does not yet exist.

How Trace Consultants Can Help

At Trace Consultants, maverick spend reduction is typically one workstream within a broader Procurement engagement — not a standalone exercise. The reason is that maverick spend is usually a symptom of procurement gaps: incomplete contract coverage, inadequate preferred supplier panels, overly complex processes, or insufficient spend visibility. Fixing the symptom without addressing the underlying structure produces temporary improvement that does not sustain.

We bring spend analytics capability to identify the scale and distribution of maverick spend, procurement operating model design expertise to address the structural causes, category management capability to build the contract coverage that eliminates the gaps, and process improvement skills to design the governance framework that makes compliant purchasing the easy path.

We work across retail, property and hospitality, health and aged care, FMCG and manufacturing, and government — sectors where the balance between operational urgency and procurement governance is a live tension, and where getting that balance right requires sector knowledge as much as procurement methodology.

Explore our Procurement capability →

Speak to an expert at Trace →

Where to Start

The first step is measurement. If you do not know your PO coverage rate, your preferred supplier compliance rate by category, or your purchase price variance, you do not have a clear picture of the problem. A spend analysis — two to four weeks — will quantify the maverick spend exposure and identify where it is most concentrated.

From there, the highest-value interventions can be prioritised: typically a combination of process simplification, contract coverage extension in high-maverick categories, and supplier performance remediation where off-contract behaviour is driven by supplier failure rather than policy non-compliance.

The organisations that reduce maverick spend sustainably are the ones that treat it as a systems problem, not a behaviour problem. The behaviour follows the system. Fix the system.

Explore our Procurement capability →

Speak to an expert at Trace →

Procurement

Supplier Rationalisation: When Fewer Suppliers Means Better Outcomes

David Carroll
March 2026
Supplier sprawl is one of the most common — and most quietly expensive — problems in Australian procurement. Here's what rationalisation actually involves and how to do it properly.

Supplier Rationalisation: When Fewer Suppliers Means Better Outcomes

Most Australian organisations have too many suppliers. Not slightly too many — significantly too many. The typical mid-sized organisation, when it conducts its first serious spend analysis, discovers that it is actively transacting with hundreds of suppliers across its spend base, many of which it could not name and most of which it has never strategically assessed. A substantial proportion of that supplier base is duplicative, underperforming, or simply an artefact of years of decentralised purchasing decisions made without any overarching supplier strategy.

This condition — supplier sprawl — is not a trivial administrative issue. It has direct, measurable financial consequences: fragmented volume that cannot be aggregated for leverage, contract management overhead that consumes procurement capacity without creating value, compliance and risk exposure that sits below the radar, and relationships that are too shallow with too many suppliers to produce genuine commercial outcomes with any of them.

Supplier rationalisation is the process of deliberately reducing and restructuring the supplier base to address these problems. It is one of the highest-return procurement interventions available to Australian organisations — when it is done properly, with a clear methodology and genuine discipline in execution.

This article explains what supplier rationalisation is, when to do it, how to approach it, and where the risks lie.

What Supplier Rationalisation Actually Is

Supplier rationalisation is sometimes described simply as "reducing supplier numbers." That framing is misleading — it focuses on the outcome rather than the purpose, and it encourages approaches that reduce headcount without improving outcomes.

A more useful definition: supplier rationalisation is the process of restructuring the supplier base so that the organisation's external spend is concentrated with the right number of suppliers, selected and managed to deliver maximum value on cost, quality, service, risk, and strategic alignment.

The emphasis on "right number" is important. Rationalisation does not always mean fewer suppliers. In some categories, the organisation may be dangerously over-concentrated — sole-sourced on critical inputs with no viable alternative, exposing it to unacceptable supply continuity risk. In those categories, rationalisation means adding suppliers, not removing them. The goal is a supplier base that is optimised for value and risk management across the full spend portfolio — not one that simply has fewer line items on the vendor master file.

What rationalisation typically involves in practice is a combination of:

Elimination of suppliers that are genuinely redundant — supplying the same goods or services as other suppliers on the panel, but at worse prices or lower service levels, without justification.

Consolidation of fragmented spend — categories where multiple suppliers are serving the same need, and where aggregating that spend with fewer providers would produce better commercial outcomes through volume leverage.

Standardisation of specifications — rationalising the products and services being purchased so that fewer variants need to be sourced, which in turn reduces the number of suppliers required.

Exit of underperforming suppliers — removing from the approved vendor base suppliers that consistently fail on quality, service, or compliance, regardless of their historical relationship with the organisation.

Development of strategic suppliers — deepening relationships with a smaller number of high-value suppliers to move beyond transactional pricing toward genuine partnership: joint planning, innovation, continuous improvement, and aligned commercial incentives.

How Supplier Sprawl Happens

Understanding why organisations end up with bloated supplier bases makes it easier to design the governance that prevents recurrence after rationalisation.

The most common causes are structural:

Decentralised purchasing without category governance. When operational managers have the authority to engage new suppliers without central oversight, the vendor master expands with every purchasing decision. Over time, the same category is served by multiple suppliers engaged by different parts of the business, each on their own terms, with no aggregation of volume.

Mergers, acquisitions, and organisational growth. When two organisations merge, their supplier bases are rarely rationalised promptly. Both sides continue transacting with their legacy suppliers, the combined organisation inherits the complexity of both bases, and the rationalisation work is deferred indefinitely because it is difficult and no one owns it.

Contract expiry without sourcing. When contracts expire and are not renewed through a proper sourcing process, purchasing reverts to ad hoc arrangements. New suppliers are engaged on a transactional basis to fill gaps, and the supplier base expands without strategic intent.

Risk management instinct without risk management discipline. Procurement teams sometimes maintain large supplier panels in the name of resilience — "we don't want to be exposed to a single supplier." This instinct is not wrong, but it is not the same as a risk management strategy. A panel of twelve suppliers for a low-value, low-risk category creates administrative overhead without meaningful resilience improvement. Real resilience means having one or two credible alternative suppliers for genuinely critical categories — not maintaining a sprawling panel for every category regardless of criticality.

The Case for Rationalisation: What It Actually Delivers

The value case for supplier rationalisation is well established and consistent across sectors and organisation types. The specific quantum depends on the starting point and the rigour of execution, but the levers are predictable.

Direct cost reduction through volume aggregation. Concentrating spend with fewer suppliers increases the volume each supplier receives, which improves the organisation's negotiating leverage and typically produces unit price reductions. The magnitude depends on the category, but 5–15% unit cost reductions through consolidation are common in indirect categories where spend was previously fragmented. In direct categories with high unit volumes, the improvement can be larger.

Reduction in procurement transaction costs. Every active supplier relationship generates administrative overhead: purchase orders, invoices, payment runs, supplier onboarding, compliance checks, insurance certificate management, and contract renewals. Eliminating low-value, non-strategic suppliers directly reduces this overhead. Procurement teams that spend 60% of their time processing transactions with tail-spend suppliers — suppliers that collectively represent 5–10% of total spend — are not spending that time on category strategy. Rationalisation frees up capacity for higher-value work.

Improved supplier performance through relationship depth. Suppliers invest in the relationships that matter commercially. A supplier that receives $50,000 annually from an organisation treats that relationship differently from one receiving $2M. Concentrating spend with fewer suppliers creates the conditions for genuine supplier investment: dedicated account management, priority service capacity, willingness to invest in process improvement, and openness to commercial innovation. The organisations that consistently achieve the best supplier performance are not the ones with the largest supplier panels — they are the ones with the most strategically managed supplier relationships.

Better risk management through intentional design. Counterintuitively, a rationalised supplier base often provides better risk management than a sprawling one. A large supplier panel creates the illusion of resilience but typically delivers fragmentation: no single supplier has enough invested in the relationship to prioritise continuity, compliance monitoring is too diluted to be effective across hundreds of vendors, and the organisation has no real understanding of its dependency on any particular supplier. A well-designed rationalised base, with deliberate decisions about where concentration is acceptable and where diversification is required, produces a risk profile that is genuinely understood and managed.

Enhanced ESG and compliance management. Modern procurement requirements — modern slavery obligations, sustainability reporting, ethical sourcing due diligence — are materially easier to execute with a smaller, better-known supplier base. Conducting modern slavery due diligence on 600 active suppliers is a compliance exercise in name only. Conducting it properly on 150 suppliers is achievable. The regulatory and reputational risk associated with a poorly managed supplier base scales with supplier numbers.

The Rationalisation Process

A well-run supplier rationalisation programme follows a structured sequence. The specific scope and depth varies with organisation size and complexity, but the core stages are consistent.

Stage 1: Spend Analysis and Supplier Mapping

The first requirement is data: a clear, accurate picture of what the organisation is spending, with which suppliers, in which categories, across which business units.

This spend analysis is frequently more difficult than it should be — because ERP and finance systems are often not configured to produce reliable spend-by-supplier-by-category data without significant data cleansing work. Supplier names may be inconsistent across systems. Spend may be coded to incorrect cost centres. Transactions may be below purchase order thresholds and therefore untracked.

Getting the data right is worth the effort. A spend analysis that understates the supplier count, misattributes spend to the wrong categories, or misses transactional spend below purchase order thresholds will produce a rationalisation programme that misses a substantial portion of the opportunity.

The output of this stage is a complete spend and supplier map: total spend by supplier, total spend by category, the distribution of supplier count by spend band (how many suppliers account for 80% of spend, how many account for the bottom 5%), and an initial view of where fragmentation and duplication is most visible.

Stage 2: Segmentation and Prioritisation

Not all categories warrant the same rationalisation approach, and not all suppliers are candidates for removal. Segmentation structures the analysis.

Category segmentation classifies spend categories by their strategic importance and supply market complexity — typically using a framework that considers spend magnitude, the number of current suppliers, the competitive structure of the supply market, and the risk of supply continuity. High-spend, fragmented categories with a competitive supply market are typically the highest-priority rationalisation opportunities. Low-spend categories with specialist or sole-source supply markets require a different approach.

Supplier segmentation classifies current suppliers by their strategic value to the organisation — distinguishing strategic suppliers (high-spend, critical supply, relationship investment warranted), preferred suppliers (approved, performing, but not relationship-intensive), and transactional or tail-spend suppliers (low-spend, easily substituted, candidates for elimination or absorption into preferred supplier agreements).

This segmentation produces the prioritisation for the programme: which categories to address first, and what approach is appropriate for each.

Stage 3: Target Supplier Base Design

For each priority category, define what the target supplier base looks like: how many suppliers, which ones, and on what commercial structure.

This is not simply a matter of keeping the best performers and removing the rest. It requires a view of the supply market: which suppliers have the capability, scale, and geographic reach to absorb consolidated volumes, which would benefit most from the additional spend, and where competitive tension needs to be maintained to prevent a consolidated supplier from becoming complacent.

For most indirect categories, the target is typically one to three preferred suppliers per category, supported by a clear qualification process for any new supplier additions. For critical direct materials or services with genuine supply continuity risk, dual or multi-source designs may be appropriate — but designed deliberately, not by default.

Stage 4: Transition and Consolidation

Transitioning from the current supplier base to the target state is the most operationally demanding stage. It requires: communicating decisions to affected suppliers (including those being exited), managing the transition of spend to preferred suppliers, ensuring no service continuity gaps during the transition, updating purchase order and contract management systems to reflect the new approved supplier panel, and managing the internal change with business units that may have established relationships with suppliers being removed.

Transition risk is frequently underestimated. The organisations that execute rationalisation most cleanly are the ones that treat the transition as a project — with a plan, a timeline, clear ownership, and active monitoring — rather than assuming it will happen organically once the strategic decisions have been made.

Stage 5: Governance to Prevent Recurrence

The most important stage is the one most commonly skipped: building the governance mechanisms that prevent the supplier base from re-sprawling over time.

Without governance, rationalisation is a periodic exercise rather than a structural improvement. The supplier base contracts, and then expands again over the following two to three years as decentralised purchasing decisions accumulate. The next rationalisation programme addresses the same problem the previous one solved.

Effective governance includes: a controlled supplier onboarding process that requires procurement approval for any new supplier addition, a regular (typically annual) review of the approved supplier panel to confirm that all suppliers meet performance and compliance standards, clear delegation of authority that prevents operational managers from engaging unapproved suppliers, and a vendor master management process that systematically identifies and removes inactive or duplicate suppliers.

Where Rationalisation Goes Wrong

Several failure modes appear consistently in supplier rationalisation programmes.

Rationalising without a sourcing strategy. Reducing supplier numbers without first running a proper sourcing process — one that confirms the right suppliers are being retained, on the right terms, with the right commercial structure — can consolidate spend with suppliers that are not delivering best value. The supplier count reduces, but the commercial outcome does not improve because no competitive process was run.

Cutting too far in critical categories. The pressure to reduce supplier numbers can lead organisations to consolidate beyond the point that is prudent for risk management. Single-sourcing critical inputs — materials or services for which there is no readily available alternative and whose disruption would have a material operational impact — is a risk that many organisations underestimate until they experience a supply failure. Rationalisation decisions in critical categories need explicit risk assessment, not just commercial optimisation.

Ignoring the tail. Tail-spend suppliers — the long tail of low-value suppliers that collectively represent a small fraction of total spend but a disproportionate share of transaction volume and administrative overhead — are frequently the last category addressed in a rationalisation programme, because the individual savings per supplier are small. This is the wrong prioritisation. The tail is where most of the administrative burden sits, and where compliance and risk exposure is most likely to be unmanaged. Addressing the tail — through preferred supplier catalogues, managed service providers, or corporate card programmes — often delivers more productivity improvement than the high-value category consolidations.

No transition plan. Particularly in operational categories where incumbent suppliers provide critical services, a poorly managed transition can create real service disruption. Transition planning needs to start at the point the rationalisation decision is made, not after.

Forgetting internal customers. Business unit managers who have established relationships with suppliers being removed from the panel will resist rationalisation if they are not engaged early, if the rationale is not communicated clearly, and if the preferred suppliers being retained do not credibly meet their requirements. Supplier rationalisation is a change management challenge as much as a procurement one.

How Trace Consultants Can Help

At Trace Consultants, supplier rationalisation is a core component of our Procurement practice. We have designed and executed rationalisation programmes across a wide range of Australian organisations and spend categories — from facilities management and professional services consolidation in property and hospitality, to direct materials rationalisation in FMCG and manufacturing, to operational services consolidation in health and aged care.

Our approach integrates rationalisation with the sourcing work that makes it commercially effective. We do not just reduce supplier numbers — we ensure that the suppliers retained are selected through a proper competitive process, on the right commercial terms, with the right governance to sustain the improvement. The combination of rationalisation and strategic sourcing consistently delivers better outcomes than either approach in isolation.

We work across property and hospitality, FMCG and manufacturing, retail, health and aged care, and government and defence. We also bring Resilience & Risk Management thinking to rationalisation programmes in categories where supply continuity risk needs to be explicitly assessed alongside commercial optimisation.

The starting point is typically a spend analysis and supplier landscape review — a two to three week piece of work that maps the current supplier base, identifies the highest-value consolidation opportunities, and sets the sequencing for a rationalisation programme. From there, the programme can be scoped and costed against a realistic value case.

Explore our Procurement capability →

Speak to an expert at Trace →

The Compounding Value of a Rationalised Supplier Base

The value of supplier rationalisation compounds over time in a way that is easy to underestimate from a standing start. In the first year, the benefit is primarily commercial: lower unit costs from volume aggregation, reduced transaction overhead, and improved compliance. In years two and three, the benefit shifts toward relationship quality: strategic suppliers invested in the relationship, proactively bringing cost reduction ideas, process improvements, and market intelligence that the organisation could not access through a fragmented, transactional supplier base.

The organisations with the strongest procurement outcomes over the long run are not the ones that run the most sourcing events. They are the ones that have built the most strategically structured supplier bases — and then manage those relationships deliberately.

Rationalisation is not a once-and-done exercise. It is a capability: the discipline of managing the supplier base as a strategic asset, rather than letting it accumulate by default.

Explore our Procurement capability →

Speak to an expert at Trace →

Procurement

Procurement Operating Model Design for Australian Organisations

David Carroll
March 2026
Most procurement functions are structured by accident, not design. Here's what a deliberate procurement operating model looks like — and how to build one that delivers sustained value.

Procurement Operating Model Design for Australian Organisations

Most Australian organisations have a procurement function. Far fewer have a deliberately designed procurement operating model.

The distinction matters more than it might appear. A procurement function is a group of people who handle purchasing activities. A procurement operating model is the architecture — the structure, governance, roles, processes, technology, and capability — that determines how much value that function can actually deliver. The same spend base, managed through a well-designed operating model versus a poorly designed one, can produce radically different outcomes: not percentage points of difference, but multiples.

This article explains what a procurement operating model is, what the core design choices are, how Australian organisations approach the design process, and what the failure modes look like. It is written for Chief Procurement Officers, CFOs, and operational leaders who are thinking seriously about whether their current procurement structure is fit for purpose — and what to do if it is not.

What Is a Procurement Operating Model?

A procurement operating model defines how the procurement function is organised and how it operates. It answers a set of interconnected questions:

  • Structure: Where does procurement authority sit — centralised, decentralised, or some hybrid?
  • Scope: What spend categories and business units does procurement cover?
  • Roles and responsibilities: Who does what — and who decides?
  • Governance: What authorities, policies, and delegations govern procurement activity?
  • Processes: How are sourcing, contracting, purchasing, and supplier management activities performed — and to what standard?
  • Technology: What systems support the procurement function, and how are they used?
  • Capability: What skills and capacity does the function require to execute its mandate?
  • Performance: How is procurement value measured and reported?

The operating model is the blueprint that holds these elements together. When it is well designed and well implemented, procurement operates as a coherent function with clear accountability, consistent processes, and the capacity to deliver value at scale. When it is poorly designed — or not designed at all — the result is fragmentation: duplicated effort, inconsistent supplier terms, maverick spend, compliance failures, and a function that struggles to demonstrate its contribution.

The Three Core Structural Models

The foundational structural choice in procurement operating model design is the degree of centralisation. Three broad models exist, each with distinct trade-offs.

Centralised Procurement

In a centralised model, all procurement authority is held by a single function — typically a central procurement team reporting to a CPO or CFO. All significant purchasing decisions flow through this team, regardless of which business unit, division, or site is the end user.

Centralised models deliver the most spend visibility, the strongest aggregation of volume across the organisation, and the most consistent supplier terms. They are the natural structure for organisations that want to maximise leverage with suppliers, enforce compliance, and build deep category expertise. They work well in organisations with relatively homogeneous spend across business units, or where the cost efficiency and governance benefits of centralisation outweigh the need for local responsiveness.

The risk of full centralisation is distance from the business: a central procurement team that is perceived as slow, rigid, or insufficiently attuned to operational requirements will be bypassed. Maverick spend — purchasing outside approved channels or contracts — is the most visible symptom of a centralised model that has lost the confidence of its internal customers.

Decentralised Procurement

In a decentralised model, procurement authority sits with individual business units, divisions, or sites. Each unit manages its own purchasing, selects its own suppliers, and negotiates its own terms. There is little or no central oversight.

Decentralised models maximise responsiveness and local flexibility. They suit organisations where business units have genuinely different requirements — different sectors, different geographies, different supply markets — where centralising procurement would produce a function that is too generic to be useful. They are common in early-stage or rapidly growing organisations that have not yet accumulated the scale or the management bandwidth to build a central function.

The cost is predictable: fragmented spend visibility, duplicated effort across units, inconsistent supplier terms, no volume aggregation, and a higher risk of compliance failures. Organisations with decentralised procurement consistently pay more for the same goods and services than they need to — because they are not leveraging their combined purchasing power.

Centre-Led Procurement

The centre-led model is the dominant structure in well-run Australian organisations of meaningful scale. It combines centralised strategy with decentralised execution: a central procurement team owns category strategy, sourcing processes, supplier agreements, policy, and governance. Business units and operational teams operate within that framework — accessing approved suppliers, placing orders, and managing day-to-day supplier relationships within defined parameters.

The centre-led model resolves the core tension in procurement structure: the need for volume aggregation and strategic coherence on one side, and operational responsiveness and local relevance on the other. It does not require all purchasing to flow through a central team. It requires that the strategic decisions — who the organisation buys from, on what terms, and under what conditions — are made centrally, with the benefits distributed operationally.

Research by The Hackett Group indicates that around two-thirds of organisations are moving toward hybrid models that combine elements of different approaches. Ankura In Australian practice, the centre-led model in some form has become the default for organisations above approximately $500M in revenue — though the specific design varies considerably.

The Six Design Dimensions

Choosing a structural model is necessary but not sufficient. A well-designed procurement operating model requires deliberate choices across six dimensions.

1. Scope and Mandate

Define what the procurement function is responsible for. This sounds obvious but is frequently ambiguous in practice — with different assumptions held by the procurement team, the CFO, and operational leaders about which categories and activities procurement owns.

Scope decisions include: which spend categories are under procurement management (indirect categories like FM, IT, professional services, and fleet alongside direct materials or operational inputs), which business units or entities are within the procurement mandate, and whether procurement's role is to execute sourcing or to set strategy and governance while execution sits elsewhere.

A narrow mandate — procurement responsible only for major sourcing events on a subset of categories — limits the function's impact. A broad mandate — procurement responsible for all significant external spend — maximises value but requires the capability and capacity to match. The right scope for any organisation depends on its procurement maturity, the complexity of its spend base, and the appetite of leadership to resource the function appropriately.

2. Organisational Structure and Roles

Design the team structure: how many people, in what roles, reporting to whom, and organised around what logic — category, business unit, or a combination.

In centre-led models, the typical structural tension is between category management depth (teams organised by spend category, building deep market knowledge) and business unit alignment (teams organised by internal customer, building strong relationships with operational stakeholders). Larger procurement functions typically combine both: category specialists who own sourcing strategy and market expertise, and business partners who own the relationship with specific business units and translate operational requirements into category plans.

Role definition is as important as headcount. A clear distinction between strategic roles (category management, strategic sourcing, contract management, supplier relationship management) and transactional roles (purchase order management, invoice resolution, supplier onboarding) is essential for a function that wants to mature beyond execution toward genuine strategic contribution.

Reporting lines matter too. Procurement functions that report to the CFO are typically treated as cost control functions — valued for savings and compliance. Functions that report to a COO or CEO have a broader mandate and are more likely to be engaged on supply chain strategy, risk management, and supplier innovation. Neither structure is inherently superior, but the reporting line signals — to the rest of the organisation — what the function is for.

3. Governance and Decision Rights

Governance defines the rules within which procurement operates: what authority levels apply, who can approve what, how exceptions are handled, and how compliance is monitored.

In practice, procurement governance breaks down into three layers:

Policy: The principles and rules that govern procurement activity — what processes must be followed, what minimum requirements apply to sourcing events of different values, what conflict of interest and probity obligations apply.

Delegation of authority: The specific dollar thresholds and category boundaries that determine who can approve purchases at each level of the organisation — from operational managers approving low-value purchases to CPOs or boards approving major contracts.

Compliance and audit: The mechanisms that monitor adherence to policy and delegation — spend visibility tools, purchase order compliance tracking, contract register management, and periodic audit of sourcing activities.

Governance design is where procurement operating models most frequently fail in practice. Governance that is too tight creates friction, drives maverick spend, and makes procurement the enemy of operational speed. Governance that is too loose is effectively no governance: policy exists on paper but not in practice, and the organisation has no reliable visibility into what it is spending or with whom.

4. Category Management Structure

Category management is the ongoing strategic oversight of groups of related spend — the activity that determines how the organisation approaches its supply markets, develops its sourcing strategies, and manages its supplier relationships over time.

A well-designed operating model defines which categories exist, who owns them, what the category manager is accountable for (category strategy, sourcing events, contract management, supplier performance, spend reporting), and how frequently category strategies are reviewed and refreshed.

The number and depth of categories the organisation can actively manage is constrained by the size of the procurement team. Prioritisation is therefore essential: not every category warrants the same investment of category management effort. High-spend, strategically important, or competitively sensitive categories deserve dedicated category management. Lower-spend, commodity categories may be managed more lightly — through standing contracts, catalogue purchasing, or periodic sourcing events rather than continuous active management.

5. Process Architecture

Define the standard processes through which procurement operates: the source-to-contract process (from category strategy and sourcing through to contract execution), the purchase-to-pay process (from purchase requisition through to invoice payment), the supplier onboarding and management process, and the contract management process.

Process architecture design involves decisions about which activities are standardised (the same process applies regardless of category or business unit), which are scaled (different processes apply at different spend thresholds), and which are flexible (category-specific processes apply for specific contexts).

Technology is inseparable from process architecture. The procurement technology landscape has matured substantially — e-sourcing platforms, contract management systems, supplier information management tools, and procure-to-pay systems each support specific process domains. Designing the process architecture and the technology architecture together, rather than sequentially, produces much better outcomes than retrofitting technology onto existing processes.

6. Capability and Capacity

The operating model cannot exceed the capability of the team that operates it. Capability assessment — an honest evaluation of the skills, experience, and capacity the procurement team currently has against what the target operating model requires — is essential before designing a model that the team cannot deliver.

Common capability gaps in Australian procurement functions include: strategic sourcing and category management skills (moving beyond transactional tendering to genuine market strategy), commercial negotiation (the structured negotiation of complex supplier arrangements), data analytics (building and using spend analytics and market benchmarking), and supplier relationship management (developing differentiated relationships with strategic suppliers).

Capability gaps can be addressed through recruitment, training and development, or the targeted use of external expertise for categories where the internal team lacks sufficient depth. The operating model design should include a capability roadmap — a realistic plan for building the skills the function needs to deliver its mandate over a 2–3 year horizon.

The Design Process

Designing a procurement operating model from scratch — or redesigning an existing one — follows a structured process.

Diagnose the current state. Before designing anything, understand the current position: what the existing model looks like, where it is performing well, and where it is failing. Current state assessment typically covers spend analysis (what is being spent, with whom, in which categories), organisational review (team structure, roles, headcount, reporting lines), process review (how sourcing, contracting, and purchasing actually operate — not just on paper), governance review (what policies and delegations exist and whether they are followed), and technology review (what systems are in use, how they are used, and where the gaps are).

Define the design principles. Before making structural decisions, agree on the principles that should guide the design. These typically include: the balance between centralised control and operational flexibility, the ambition level (cost control function vs. strategic business partner), the technology investment appetite, and the timeline for implementation. Design principles prevent the process from becoming a debate about specific structural choices before the underlying priorities have been agreed.

Develop and evaluate structural options. Model two or three structural scenarios — typically a more centralised option, a centre-led option, and a more decentralised option — against the design principles and the specific context of the organisation. The evaluation should be explicit about the trade-offs: each model will perform better on some dimensions and worse on others. The right choice is the one that best fits the organisation's priorities, not the theoretically optimal model.

Design the target model in detail. Once the structural approach is agreed, design the target model across all six dimensions: structure, scope, governance, category management, processes, and capability. This produces the operating model blueprint — a detailed specification of how the function will operate at the end of the transformation.

Develop the implementation roadmap. Design the path from current state to target state: the sequence of changes, the transition arrangements, the change management plan, and the milestones that track progress. Operating model transformations typically take 12–24 months to implement meaningfully, with the full value of the new model visible over a 3–5 year horizon.

What Australian Organisations Get Wrong

Several failure modes appear repeatedly in procurement operating model work across Australian organisations.

Designing for theory, not context. Generic best-practice frameworks — "you should be centre-led with category management" — are a starting point, not an answer. The right operating model for a $2B retail group is different from the right model for a $500M government-owned corporation, which is different again from the right model for a $5B integrated resort operator. Operating model design must be grounded in the specific context of the organisation — its sector, its spend profile, its geographic footprint, its culture, and its procurement maturity.

Structural change without process change. The most common failure in procurement operating model transformations is reorganising the team without changing the processes. Restructuring from a decentralised to a centre-led model while leaving the sourcing, contracting, and purchasing processes unchanged produces a new org chart, not a new capability. Structure and process need to be redesigned together.

Underestimating change management. Procurement operating model change affects every business unit that interacts with procurement — which is most of the organisation. The transition from decentralised purchasing (where operational managers have autonomy) to a centre-led model (where strategic decisions sit with a central team) is a significant change for the business, not just for the procurement function. Failing to manage that change — to communicate why the new model is better, to train stakeholders on new processes, to build trust between the central team and business units — produces resistance, workarounds, and maverick spend.

Technology as the solution, not the enabler. A recurring pattern is organisations that invest in a Source-to-Pay technology platform expecting it to transform their procurement function — and are then surprised when it does not. Technology enables a well-designed operating model. It cannot substitute for one. Investing in e-sourcing or P2P technology before designing the operating model and processes it needs to support typically produces a technology deployment that is underused, resisted, or bypassed.

Underfunding the function. The procurement function is consistently underfunded relative to its potential return. A function managing $500M in external spend, staffed with five people predominantly focused on transactional processing, has neither the capacity nor the capability to run a strategic sourcing programme that captures 10% improvement across the spend base. Organisations that design an ambitious operating model and then refuse to resource it appropriately will be disappointed by the outcomes.

How Trace Consultants Can Help

At Trace Consultants, procurement operating model design is core to what we do. We work with Australian organisations to diagnose their current procurement capability, design the operating model that is right for their context, and implement the changes needed to make it work — including the process design, governance frameworks, technology selection, and capability development that sit alongside the structural changes.

Our Procurement team brings direct category expertise and operating model experience across sectors including retail, property and hospitality, health and aged care, government and defence, and FMCG and manufacturing. We have designed and implemented operating models for organisations at very different starting points — from government agencies building a procurement function from near-scratch, to large commercial organisations redesigning a mature function that has stopped delivering value.

Our approach is distinctive in three ways. We design operating models that are realistic: calibrated to the organisation's actual capability, culture, and appetite for change, not idealised models that exist only on paper. We integrate operating model design with category strategy work — because the operating model is only valuable insofar as it enables better sourcing outcomes. And we focus on implementation, not just design: the blueprint is only the starting point.

Whether your challenge is fragmented spend and no visibility, a procurement team that is overwhelmed by transactional work and unable to do category strategy, governance failures and compliance risk, or a function that has simply stopped delivering value, we can help.

We also offer Organisational Design capability for broader functional design work, and Project & Change Management for operating model implementation programmes.

Explore our Procurement capability →

Speak to an expert at Trace →

Procurement

How to Run a Strategic Sourcing Process in Australia

Emma Woodberry
March 2026
Most Australian organisations buy things. Fewer source strategically. Here's what separates the two — and how to run a process that delivers real, repeatable savings.

How to Run a Strategic Sourcing Process in Australia

Most Australian organisations have a procurement function. Fewer have a strategic sourcing capability. The difference matters — significantly.

Transactional procurement is the process of buying goods and services when the business needs them, at the best price available at the time. It is reactive, category-agnostic, and driven by the immediate requirement. It keeps the lights on. It does not deliver the 10–25% cost reductions and supply chain improvements that a well-run strategic sourcing programme consistently achieves.

Strategic sourcing is different in kind, not just in degree. It is a structured, data-driven process of understanding what the organisation spends, what the supply market looks like, what the organisation's requirements actually are, and how to go to market in a way that captures maximum value — on cost, quality, service, risk, and increasingly, sustainability. It treats categories of spend as long-term management challenges rather than individual transactions. And it produces results that compound: each well-run sourcing cycle builds market knowledge, supplier relationships, and internal capability that makes the next one better.

This article explains what strategic sourcing is, how the process works in practice, what Australian organisations most commonly get wrong, and how to build the capability to do it consistently.

Strategic Sourcing vs. Procurement: The Practical Distinction

Strategic sourcing and procurement are often used interchangeably, but the distinction is worth being precise about — because conflating them leads organisations to underinvest in the strategic work and wonder why their procurement costs don't improve.

Procurement encompasses the full cycle of acquiring goods and services — identifying needs, selecting suppliers, placing orders, receiving goods, and processing invoices. It is operational in orientation: concerned with executing purchases efficiently and in compliance with policy.

Strategic sourcing sits upstream. It determines who the organisation should be buying from, on what terms, under what commercial structures, and with what supplier relationships — before the operational procurement process begins. Its outputs are supplier agreements, category strategies, and commercial frameworks within which operational procurement then executes.

The relationship between the two is sequential: strategic sourcing creates the conditions for procurement to operate efficiently. An organisation running good procurement on bad supplier agreements is leaving money on the table. An organisation with well-structured supplier agreements but poor operational procurement is creating compliance failures. Both matter. Strategic sourcing comes first.

When to Run a Strategic Sourcing Process

Not every category of spend warrants a full strategic sourcing process at every contract renewal. The question is which categories merit the investment of time and resource that strategic sourcing requires — and the answer depends on the spend profile, the supply market, and the strategic importance of the category.

As a general framework, a full strategic sourcing process is warranted when one or more of the following conditions apply:

The category is material in value. Spend categories that represent significant total expenditure — typically any category above $500K annually for mid-sized organisations, or above $2–3M for larger ones — warrant the rigour of a structured sourcing process. The return on investment is clear: a 10% improvement on a $5M category is $500K. That more than justifies the cost of running the process properly.

The contract is expiring or due for renewal. Contract renewals are a natural trigger for strategic sourcing — and the organisations that approach renewals as an opportunity to run a genuine market process, rather than as an administrative exercise of extending the incumbent, consistently achieve better outcomes. The incumbent knows the contract is up; the question is whether the buyer is serious about competition.

The supply market has changed materially. New entrants, technology disruptions, consolidation among suppliers, or significant cost input changes can fundamentally alter the competitive dynamics of a supply market between sourcing events. A category that was well-sourced three years ago may have a very different optimal commercial structure today.

The organisation's requirements have changed. Volume growth or decline, changes in specification, new service requirements, or shifts in the geographic footprint of the operation all create conditions where the existing supplier arrangement may no longer be the right one.

There is evidence of value leakage. Persistent cost increases beyond CPI, growing variation spend, service quality issues, or benchmarking data that suggests pricing is above market rates are all signals that the current supply arrangement is not delivering full value — and that a sourcing event is warranted.

The Seven-Stage Strategic Sourcing Process

Strategic sourcing follows a logical sequence. The specific tools and techniques within each stage vary by category complexity, market structure, and organisational context, but the core stages are consistent.

Stage 1: Category Definition and Scope

Before running any analysis, define exactly what is being sourced. Category definition sounds straightforward but is frequently done carelessly — with consequences for the quality of every subsequent stage.

Scope too broadly and the category becomes unmanageable: requirements are heterogeneous, suppliers cannot credibly address the full scope, and commercial clarity is impossible. Scope too narrowly and the organisation loses the aggregation benefits that drive competitive tension and unit cost reduction.

The right scope definition starts with spend data: what is currently being purchased, from whom, at what volumes, and across which cost centres and business units. It then considers what the natural boundaries of a category are from a supply market perspective — which products and services are typically supplied by the same providers, and therefore belong together in a category structure that drives competition.

For large, diverse organisations, this categorisation exercise — building a spend taxonomy that organises expenditure into logical sourcing categories — is itself a significant piece of analytical work. It is also foundational: everything downstream depends on having spend organised into categories that are sourced coherently.

Stage 2: Internal Requirements Analysis

Once the category scope is defined, understand what the organisation actually needs — which is often different from what it has been buying.

Internal requirements analysis involves engaging the stakeholders who use the category: operations teams, technical specialists, finance, legal, and any other function with a legitimate interest in the supply outcome. The goal is to build a clear, shared understanding of requirements before going to market — covering functional specifications (what the product or service must do), service requirements (delivery frequency, lead times, response times), quality standards, volume forecasts, and any constraints (incumbent system integrations, regulatory requirements, site access considerations).

This stage frequently surfaces requirement gaps that would otherwise become costly variations or disputes post-contract. It also identifies where requirements have evolved beyond what the current contract delivers — and where there may be opportunities to simplify or standardise specifications in ways that broaden the competitive field and reduce cost.

Stage 3: Supply Market Analysis

Strategic sourcing requires genuine market intelligence — not just a list of potential suppliers, but a structured understanding of the supply market: who the credible providers are, how the market is structured (concentrated or fragmented, national or regional, specialist or generalist), what the cost drivers are, where the leverage sits, and what risks the supply market presents.

Supply market analysis typically covers: identification of all credible suppliers in the market (existing and new), assessment of each supplier's capabilities, financial health, capacity, and market positioning, analysis of cost structure and input cost drivers, competitive dynamics (are suppliers competing aggressively for new business, or is the market oligopolistic?), and regulatory or compliance considerations specific to the category.

This analysis directly informs the sourcing strategy. A category with a fragmented, competitive supply market suggests an open competitive tender with a focus on price. A category with two or three credible global suppliers suggests a different approach — more emphasis on total value, relationship, and risk management, with price as one of several evaluation dimensions.

Stage 4: Sourcing Strategy Development

With spend data, requirements, and market analysis in hand, develop the sourcing strategy — the decisions about how to go to market that will maximise value for the organisation.

The core strategic decisions are:

Bundling vs. unbundling. Should related spend categories be combined into a single sourcing event (to leverage total volume and simplify supplier management) or separated (to access specialist suppliers and maximise competition on each element)? This decision significantly affects which suppliers can compete and what commercial terms are achievable.

Make vs. buy. Before going to market for a supply solution, confirm that external supply is the right answer. For some categories — particularly services — the make vs. buy question should be explicitly answered as part of the sourcing process rather than assumed. (This links directly to Trace's separate article on make vs. buy decision-making.)

Contract structure and length. Longer contracts reduce transaction cost and enable suppliers to invest in the relationship, but reduce the buyer's leverage at renewal. Shorter contracts preserve flexibility but create more frequent sourcing events. The right balance depends on the category dynamics, the capital intensity of the supply, and the rate of change in the market.

Pricing model. Fixed price, schedule of rates, cost-plus, gainshare — the pricing model determines where risk sits and what behaviour it incentivises. The right model depends on how predictable demand is, how transparent the supplier's cost structure is, and what outcomes the organisation wants the contract to drive.

Number of suppliers. Single-source arrangements maximise relationship depth and often achieve better pricing through volume commitment, but create dependency risk. Dual or multi-source arrangements provide resilience and competitive tension but add contract management overhead. The right answer varies by category and by the organisation's risk appetite.

Stage 5: Market Engagement and RFx Process

With the sourcing strategy defined, go to market. The RFx process — Request for Information (RFI), Request for Proposal (RFP), Request for Quotation (RFQ), or a combination — is the mechanism through which the organisation engages the supply market, collects proposals, and creates the competitive tension that drives value.

Market engagement before the formal RFx. For complex or high-value categories, pre-tender market engagement is valuable: industry briefings, one-on-one conversations with potential suppliers, or a formal RFI process to understand supply market capability and test appetite before committing to a full tender process. Market engagement signals seriousness, improves the quality of submissions, and prevents the embarrassment of running a tender that attracts no credible bidders.

RFP documentation quality. The quality of the RFP documentation directly determines the quality of the responses. A clear, complete, well-structured RFP — with unambiguous specifications, a coherent pricing schedule, realistic timelines, and transparent evaluation criteria — attracts better submissions and reduces the risk of post-award disputes. An ambiguous, incomplete, or poorly structured RFP invites suppliers to price in risk, which inflates cost and reduces commercial clarity.

Evaluation framework. Define how proposals will be evaluated — the criteria, their relative weightings, and the scoring approach — before submissions are received. Criteria typically cover: commercial pricing (weighted according to the category's price sensitivity), technical capability and solution quality, service and delivery model, risk and financial stability, sustainability and ESG credentials, and experience and references. The weighting should reflect what actually matters for the category, not a generic framework applied uniformly.

Shortlisting and clarification. For complex categories, a two-stage process — longlist to shortlist based on capability, then full commercial evaluation of the shortlist — reduces the cost burden on suppliers and improves the quality of detailed commercial engagement. Clarification rounds allow the buyer to probe submissions, test assumptions, and ensure that price comparisons are genuinely like-for-like.

Stage 6: Negotiation

For most categories above a material value threshold, best-and-final-offer evaluation is not the ceiling of value creation — negotiation is. The competitive tension generated by the RFP process creates negotiating leverage that skilled procurement teams use to improve commercial terms beyond the submitted proposals.

Negotiation in a strategic sourcing context is not adversarial bargaining. It is a structured process of value creation — identifying where there is room for commercial improvement, where the supplier's flexibility lies, what concessions the buyer can offer in return (longer contract terms, volume commitments, payment terms, reference opportunities), and how to reach an outcome that is commercially superior to the initial submission without compromising the supplier's willingness to invest in the relationship.

Common value creation levers in sourcing negotiation include: unit price improvement on high-volume items, reduction or elimination of price escalation mechanisms, improved payment terms, enhanced service levels or KPIs at no additional cost, inclusion of performance-linked commercial incentives, and favourable treatment of IP and data ownership.

Negotiation requires preparation: a clear understanding of the buyer's walk-away position, a realistic assessment of the supplier's flexibility, and a negotiation strategy that sequences concessions intelligently.

Stage 7: Contract Award, Transition, and Governance

The sourcing process ends with contract execution — but the value of the process is only realised if the contract is implemented effectively and managed actively over its life.

Contract design. The contract should accurately reflect the commercial outcome of the negotiation and include the governance mechanisms that protect that outcome: clear KPIs, performance measurement methodology, price review and escalation mechanisms, variation management protocols, and termination rights. Contracts that are vague on these points invite disputes.

Transition management. For categories with an incumbent supplier, the transition to a new supplier arrangement — whether a new provider or renegotiated terms with the existing one — requires active management. Transition risk is frequently underestimated in sourcing programmes. The cost of a poor transition can quickly erode the savings the sourcing event achieved.

Ongoing contract management. A well-negotiated contract that is not actively managed will deliver less value over time than one that is. KPIs need to be tracked. Price escalation clauses need to be monitored. Variation requests need to be assessed against the contract scope. Supplier performance reviews need to be conducted on a regular cadence. And the next sourcing event needs to be planned with enough lead time to run a genuine process, not a default renewal.

What Australian Organisations Most Commonly Get Wrong

Several failure modes appear consistently in strategic sourcing programmes across Australian organisations.

Skipping the spend analysis. Organisations that go to market without a clear, accurate picture of what they are actually spending — by category, by supplier, by business unit — consistently leave value on the table. Spend data is the foundation of every subsequent stage, and poor spend data produces poor sourcing outcomes.

Letting operations drive specifications. When technical or operational stakeholders write specifications without commercial input, they tend to produce specifications that are over-engineered, supplier-specific, or narrower than they need to be — all of which reduce competition and inflate cost. Specification design is a commercial decision as much as a technical one.

Running tenders, not sourcing processes. A tender that goes to market without spend analysis, requirements definition, market analysis, or a sourcing strategy is a procurement event, not a strategic sourcing exercise. It will capture some value, but not the full available opportunity.

Insufficient market engagement. Australian procurement teams are frequently risk-averse about pre-tender market engagement — concerned that talking to suppliers before the RFP compromises the process. In practice, market engagement done properly improves the quality of submissions, signals seriousness to the market, and frequently surfaces solution options that the buyer had not considered.

Treating negotiation as optional. Accepting best-and-final offers without negotiation leaves value on the table in almost every sourcing event above a material value threshold. The discomfort of negotiating is consistently outweighed by the commercial improvement it produces.

No transition plan. Sourcing events that achieve significant commercial improvement but then lose value in a poorly managed transition — service disruption, implementation delays, hidden transition costs — are a real pattern. Transition planning needs to start before contract award, not after.

How Trace Consultants Can Help

At Trace Consultants, we design and execute strategic sourcing programmes for Australian organisations across commercial, government, health, and hospitality sectors — bringing the market intelligence, commercial rigour, and negotiation capability that consistently delivers outcomes beyond what internal teams achieve working alone.

Spend analysis and category strategy. We build the spend taxonomy and category intelligence that provides the foundation for a well-sequenced sourcing programme — identifying the highest-value opportunities and the right order to pursue them.

Procurement process design and execution. We design and manage the full strategic sourcing process — from requirements analysis and market engagement through RFP development, supplier evaluation, negotiation, and contract award. We manage the process so the organisation can maintain business focus, while ensuring commercial control is retained internally.

Negotiation support. For high-value or complex categories, we provide negotiation strategy development and support — preparing the brief, identifying leverage points, and participating in negotiations to maximise commercial outcomes.

Resilience & Risk Management integration. We build supplier risk assessment into the sourcing process — ensuring that sourcing decisions account for concentration risk, financial stability, geopolitical exposure, and supply chain resilience alongside commercial metrics.

Capability building. For organisations that want to build strategic sourcing capability internally, we design and deliver capability programmes that develop procurement teams' skills in spend analysis, market assessment, RFP design, and negotiation.

We work across FMCG and manufacturing, retail, property and hospitality, health and aged care, and government and defence. The strategic sourcing methodology is consistent; the category knowledge, market intelligence, and stakeholder dynamics differ by sector — and that sector knowledge is where our value is most distinctive.

Explore our Procurement capability →

Speak to an expert at Trace →

Getting Started

For most organisations, the right starting point is a spend analysis — building a clear picture of what the organisation is currently spending, with whom, in which categories, and how that spend is distributed across the business. That analysis typically takes two to four weeks and produces both a category map and a prioritised sourcing opportunity pipeline.

From there, the highest-value categories can be sequenced into a 12–18 month sourcing programme, with the most material opportunities addressed first. The compounding effect of a sustained sourcing programme — category knowledge built in each cycle informing the next, supplier relationships improving over time, internal capability growing with each exercise — is one of the most reliable value creation mechanisms available to Australian procurement functions.

The organisations that run strategic sourcing consistently, rather than reactively, capture the most value. The ones that run it only when a contract is expiring or a cost crisis is visible capture some value, some of the time. The difference is meaningful.

Explore our Procurement capability →

Speak to an expert at Trace →

BOH Logistics

How to Reduce Food and Beverage COGS in Hospitality

Mathew Tolley
March 2026
For large-scale hospitality operators, food and beverage COGS is a nine-figure problem hiding in plain sight. Most organisations are leaving 3–7% on the table. Here's where it goes and how to get it back.

How to Improve Food and Beverage COGS in Hospitality

For a large hotel, integrated resort, or entertainment venue, food and beverage is not a supporting act. It is a core revenue stream, a major driver of guest experience, and one of the largest and most controllable cost lines on the P&L. At scale — a multi-property integrated resort group turning over hundreds of millions in F&B annually — a one percentage point improvement in COGS ratio translates directly into millions of dollars of EBITDA. The difference between a well-managed F&B cost base and a poorly managed one is not marginal. It is transformational.

Yet F&B cost management in large hospitality operations is frequently fragmented, reactive, and significantly below what structured procurement and operational discipline can deliver. Purchasing decisions are made at outlet level rather than group level. Par levels are set by chefs rather than by data. Supplier contracts renew by default rather than by design. Waste is managed by exception rather than by process. The result is a cost base that is consistently higher than it needs to be — not because the organisation lacks talent, but because it lacks the systems, processes, and procurement discipline to capture the value that scale should provide.

This article explains where F&B COGS leaks in large hospitality operations, what the improvement levers are, how to sequence them, and what a sustained cost improvement programme looks like in practice.

Understanding F&B COGS in Hospitality

Food and beverage cost of goods sold is the direct cost of the ingredients and products consumed to generate F&B revenue. It is calculated as:

F&B COGS (%) = (Cost of F&B consumed ÷ F&B Revenue) × 100

Industry benchmarks for F&B COGS vary by outlet type and service model. As a general reference, food costs typically target 28–32% of food revenue in full-service restaurant environments, beverage costs target 18–25% of beverage revenue (lower for liquor and cocktails, higher for premium wine), and blended F&B COGS across a diverse multi-outlet operation typically sits in the 30–35% range for a well-managed operation.

For integrated resorts and large multi-outlet hospitality groups, the COGS picture is more complex than a single number suggests. The blended rate reflects a mix of outlet types — fine dining, casual, quick service, banqueting, mini-bar, room service, staff cafeteria — each with different cost profiles. A property where fine dining (lower COGS) is a large share of the mix will naturally report a better blended rate than one heavily weighted toward casual and buffet formats. Understanding the composition of the COGS number is essential before designing an improvement programme.

For large Australian hospitality operators, F&B COGS improvement of 2–7% of revenue is achievable through structured procurement, inventory management, menu engineering, and waste reduction — depending on the starting position and the maturity of existing processes. At the scale of a major integrated resort group, the dollar value of that improvement range is very significant.

Where F&B COGS Leaks: The Seven Sources

F&B COGS overruns in large hospitality operations almost always trace to one or more of seven root causes. Understanding which of these is driving the cost problem in a specific operation is the essential precursor to designing the right intervention.

1. Fragmented Procurement Without Group Leverage

The most common and highest-value F&B cost leakage in multi-outlet and multi-property operations is procurement fragmentation. When individual outlets or individual properties purchase independently — each maintaining their own supplier relationships, negotiating their own prices, and ordering on their own schedules — the organisation fails to leverage the aggregated buying power that its total volume warrants.

A single integrated resort property spending $60M annually on F&B COGS, or a group with multiple properties collectively spending $150–200M, has enormous supplier leverage. Suppliers who are quoting at outlet level — against a fraction of the total volume — will price accordingly. Consolidating purchasing under a national contract or a group-level category management framework, with volume committed across the portfolio, consistently produces unit price reductions of 3–8% on key commodity categories without any change in product specification.

This is particularly true for high-spend categories with multiple credible suppliers: proteins (beef, chicken, seafood), dairy, beverages (both alcoholic and non-alcoholic), dry goods, and cleaning chemicals. In each of these categories, a structured competitive tender against consolidated volume typically reveals significant margin available in the current supply arrangements.

2. Pricing Benchmarking Gaps

Related to procurement fragmentation is the absence of systematic price benchmarking. Most large hospitality operators do not have a structured, regular process for comparing their current supplier prices against market rates. Prices agreed in a contract negotiated two or three years ago may no longer reflect current market conditions — either because commodity prices have moved, competitive dynamics have shifted, or the supplier has gradually escalated prices through the invoice process in ways that are not immediately visible.

For specialty and niche products — artisan producers, imported ingredients, premium spirits, specialist seafood — benchmarking requires genuine market intelligence rather than just a competitive tender. The price differential on these categories between what an unmanaged operation pays and what a well-benchmarked one pays can be significant, precisely because the low-volume, high-specificity nature of the purchase reduces the buyer's natural market awareness.

3. Menu Engineering Neglect

Menu engineering is the discipline of designing and managing a menu to optimise the combination of profitability and popularity across menu items. Items that are both highly popular and highly profitable — "stars" in the classic matrix — should be featured prominently and protected. Items that are low-margin and low-popularity — "dogs" — should be rationalised. Items that are popular but low-margin — "plowhorses" — should be repriced or reformulated to improve their contribution.

In large multi-outlet hospitality operations, menu engineering is frequently done once at menu launch and then not revisited until the next menu cycle — which may be 12 to 18 months later. In that interval, ingredient costs change, portion sizes drift, recipe adherence varies, and the menu's actual profitability profile diverges from the designed one. Regular, data-driven menu engineering — at least quarterly, using actual POS and recipe cost data — is one of the most cost-effective tools in F&B cost management.

Menu size rationalisation is a closely related lever. More than half of Australian restaurants reduced menu size during 2025, and operators who cut menus by 20% or more consistently reported improvements in both cost control and speed of service. For large hospitality operations with extensive menus across multiple outlets, rationalising to a focused core menu reduces ingredient complexity, purchasing breadth, waste, and kitchen labour simultaneously.

4. Inventory and Par Level Management

F&B inventory management in large hospitality operations is frequently inadequate relative to the financial exposure it represents. Par levels — the minimum stock holdings at each storage point that trigger replenishment — are often set by chefs based on experience and comfort rather than by actual consumption data. The result is chronic overstocking in some categories (particularly slow-moving specialty items and premium spirits that are ordered speculatively) and understocking in others, which drives costly ad hoc purchasing.

Overstocking directly inflates COGS through two mechanisms: spoilage and waste from products that exceed their shelf life before consumption, and the carrying cost of capital tied up in excess inventory. In a large F&B operation with significant perishable inventory, spoilage can represent 2–5% of food cost in poorly managed operations — a direct, recoverable cost leakage.

Inventory accuracy is a related issue. Stocktaking that is done infrequently, inconsistently, or without rigorous physical counting against a master product list produces variance data that cannot be trusted. Variance — the difference between theoretical and actual food cost — is one of the most powerful diagnostic tools in F&B cost management, but only when the underlying inventory data is accurate enough to make the variance signal meaningful.

5. Recipe Costing and Adherence

Every menu item should have a standard recipe cost — a precise calculation of the ingredient cost of one unit of the dish, based on current supplier prices and defined portion specifications. That standard recipe cost is the baseline against which actual food cost is measured. When actual food cost exceeds the standard recipe cost, there is variance — and that variance has a cause.

In many large hospitality operations, recipe costing is incomplete, outdated, or not systematically maintained. Recipes that were costed at the time of menu design have not been updated as ingredient prices changed. Portion specifications are defined but not consistently enforced. Substitutions are made in the kitchen without updating the recipe record. The result is that the organisation cannot distinguish between food cost overruns caused by procurement pricing (a supplier issue), portion drift (a kitchen discipline issue), waste (an operations issue), or data error (a system issue).

Building and maintaining a complete, accurate recipe costing system — and connecting it to actual purchasing data and POS revenue data — is the data infrastructure that makes F&B cost management possible at scale.

6. Receiving and Waste Controls

F&B cost leakage happens not just in the buying decision but in the receiving and operations process. Deliveries that are not checked against purchase orders — for quantity, weight, and quality — allow suppliers to short-deliver or deliver below specification without detection. Portioning that is not controlled against defined yields creates food cost variance that appears to be a purchasing problem but is actually an operations problem.

Waste in the kitchen — trim waste, preparation waste, spoilage, over-production — is a significant and frequently underestimated component of food cost. In a large banqueting operation, the difference between over-producing for a function and precise production represents a material cost difference on high-volume, high-food-cost items. Production planning discipline — forecasting function attendance accurately, setting production quantities against forecast rather than against chef intuition — directly reduces this waste.

7. Supplier Relationship Management Without Accountability

The final source of F&B cost leakage is structural: the absence of systematic supplier performance management. Suppliers who are not regularly reviewed against their contracted specifications — on pricing compliance, quality standards, DIFOT performance, and invoice accuracy — will gradually drift from their contracted terms in ways that individually appear minor but cumulatively are significant.

In large hospitality operations with hundreds of active F&B suppliers, the contract management overhead is real. But the cost of not managing supplier performance systematically — through regular scorecards, pricing audits, and structured review meetings — is consistently higher than the cost of doing it.

The Improvement Sequence

For large hospitality operators undertaking a structured F&B COGS improvement programme, the sequencing of initiatives matters. Not all levers deliver equal impact, and some require data infrastructure that needs to be built before higher-value improvements can be captured.

Phase 1: Establish the baseline (weeks 1–6). Before any procurement or operational changes, establish an accurate picture of the current COGS position. This means: mapping total F&B spend by category and by supplier across all outlets and properties, establishing the current COGS ratio by outlet type, identifying the major variance items between theoretical and actual food cost, and benchmarking current prices on key categories against market rates. This diagnostic phase defines the improvement opportunity and prioritises the interventions by value.

Phase 2: Procurement consolidation (months 2–6). The highest-impact, fastest-return initiative in most large hospitality operations is procurement consolidation — aggregating volume across outlets and properties to negotiate national or group-wide supplier agreements. This phase involves: category segmentation (which categories have sufficient volume to support consolidated contracts), market engagement (approaching the supplier market with a consolidated volume proposition), tender and negotiation, and transition to new supply arrangements. Savings of 3–8% on high-spend commodity categories are typically achievable within six months for operations that have not previously consolidated purchasing.

Phase 3: Inventory and par level optimisation (months 3–8). In parallel with procurement consolidation, address the inventory management discipline that prevents spoilage cost from eroding the procurement savings. This includes: establishing or upgrading stocktake processes, recalibrating par levels against actual consumption data, implementing waste tracking at the outlet level, and building the accountability governance for inventory performance.

Phase 4: Menu engineering and recipe costing (months 4–9). Build or update the recipe costing infrastructure and conduct a structured menu engineering review across all outlets. This phase typically identifies a further 1–2% COGS improvement opportunity through menu rationalisation, portion adjustments, and strategic repricing of high-cost low-margin items.

Phase 5: Supplier performance management (ongoing from month 6). Establish the governance framework for ongoing supplier management — quarterly pricing reviews, DIFOT scorecards, invoice audit processes, and structured renegotiation cycles. This phase locks in the procurement savings from Phase 2 and creates the commercial discipline to prevent the cost base from drifting back over time.

The Procurement Consolidation Case in Detail

Procurement consolidation deserves more detailed treatment because it is both the highest-value lever and the one most commonly underimplemented in large Australian hospitality operations.

The commercial logic is straightforward. A supplier quoting on $500,000 of annual spend from one outlet will price differently from a supplier quoting on $5 million of spend across a national portfolio. The volume-price relationship in food and beverage supply is real and significant. The question is whether the organisation has structured its procurement to capture it.

In large integrated resort and hotel group environments, the barriers to consolidation are typically organisational rather than commercial. Executive chefs have historically had significant autonomy over supplier selection — and they have strong views about product quality, supplier relationships, and the ingredients they want to use. Finance and procurement functions have limited visibility into F&B purchasing. And the operational reality of running multiple outlets with different cuisine profiles, service models, and customer expectations makes a one-size-fits-all supply approach genuinely inappropriate for some categories.

The resolution is category segmentation: identifying which spend categories are suitable for consolidated national contracts (commodity ingredients, beverage brands, cleaning products, packaging) and which genuinely require outlet-level discretion (specialty and artisan producers, specific equipment, occasion-specific premium products). For the consolidatable categories — which typically represent 60–70% of total F&B spend in a large operation — procurement consolidation captures the available leverage without constraining culinary creativity on the items where that matters.

The business case for consolidation in a large Australian hospitality operation is compelling. On a $100M F&B COGS base, a 4% improvement through consolidated procurement is $4M in annual savings. That is not a rounding error — it is a strategic initiative that warrants dedicated resourcing and executive sponsorship.

Benchmarking as the Starting Point

For organisations uncertain about the scale of their F&B cost improvement opportunity, benchmarking is the most efficient entry point. A structured benchmarking exercise compares the organisation's current F&B COGS ratio, procurement pricing, and waste rates against comparable operations — similar venue types, similar volume profiles, similar market contexts.

Benchmarking typically reveals one of three situations: the organisation is performing at or near best practice (in which case the focus shifts to sustaining performance and identifying incremental improvements); there is a moderate gap to best practice (2–3% of revenue) addressable through procurement and operational improvements; or there is a significant gap (5–8% or more) indicating structural issues in procurement, inventory management, or operations that require a more comprehensive programme.

The benchmarking exercise also identifies which specific categories or outlets are the primary drivers of the gap — enabling improvement effort to be directed where it will have the highest impact rather than applied uniformly across the operation.

How Trace Consultants Can Help

At Trace Consultants, we work with large Australian hospitality operators — integrated resorts, hotel groups, entertainment venues, and precinct operators — to systematically reduce F&B COGS through procurement excellence, inventory optimisation, and operational discipline.

F&B cost benchmarking. We conduct structured F&B cost benchmarking against comparable operations, identifying the gap to best practice by category and outlet type, and quantifying the improvement opportunity with sufficient precision to build a credible business case.

Procurement consolidation and category management. We design and execute F&B procurement consolidation programmes — from spend mapping and category segmentation through to market engagement, tender management, supplier negotiation, and transition to consolidated supply arrangements. We bring the independent market intelligence and commercial negotiation capability that consistently produces results that internal teams working alone do not achieve.

Inventory and par level optimisation. We review and redesign F&B inventory management practices — par level settings, stocktake processes, waste tracking, and the variance analysis frameworks that identify where cost is leaking and why.

Menu engineering and recipe costing. We support menu engineering reviews and recipe costing infrastructure — building the data foundation that makes ongoing F&B cost management possible and identifying the specific menu changes that improve profitability without compromising guest experience.

Supplier performance management frameworks. We design the governance processes — pricing audits, DIFOT scorecards, review cadences, and contract management disciplines — that lock in procurement improvements and prevent cost drift over the life of supplier relationships.

Our Property, Hospitality & Services sector practice brings deep understanding of the operational realities of large-scale F&B environments — the culinary dynamics, the multi-outlet complexity, and the balance between cost discipline and the guest experience standards that the brand requires. We work collaboratively with executive chefs, F&B operations teams, and finance functions to design improvements that work in practice, not just on paper.

Explore our Procurement capability →

Speak to an expert at Trace →

The Bottom Line

F&B COGS is one of the most controllable cost lines in large hospitality operations — and one of the most consistently underoptimised. The opportunity is not hidden. It sits in fragmented procurement, unmanaged inventory, outdated recipe costs, and supplier relationships that have not been reviewed with sufficient commercial rigour.

For large-scale operators, the combination of procurement consolidation, inventory discipline, and menu engineering typically delivers 3–7% COGS improvement on a blended basis. On a $100M+ COGS base, that is a material and sustainable improvement to the P&L — one that more than justifies the investment in getting the programme right.

The starting point is understanding where you currently sit relative to best practice. A benchmarking exercise, honestly conducted, will answer that question — and tell you whether the improvement opportunity is incremental or transformational.

Explore our Procurement capability →

Speak to an expert at Trace →

People & Perspectives

Supply Chain Transformation in Australian Government

Government supply chains don't fail the same way commercial ones do. They fail quietly — through accumulated process debt, fragmented contracts, capability gaps, and reform fatigue. Here's how to fix them.

Supply Chain Transformation in Australian Government: What It Takes and Why It's Different

Supply chain transformation in the Australian public sector is one of the most consequential and least well-understood improvement disciplines in Australian management consulting. Government agencies collectively spend hundreds of billions of dollars annually on goods and services. They operate logistics networks that deliver critical services — medicines to hospitals, equipment to defence bases, food to correctional facilities, materials to infrastructure projects — where failure has consequences that go well beyond a missed commercial KPI.

Yet the discipline of supply chain management in government has historically been underdeveloped relative to its commercial counterpart. Procurement has often been understood as a compliance function rather than a value creation function. Supply chain operations have been managed reactively rather than strategically. Transformation programmes have been launched, lost momentum, and quietly abandoned more often than they have delivered sustained results.

That is changing. The Commonwealth Procurement Rules overhaul that took effect in November 2025 — the most extensive reform in nearly a decade — signals a shift in how government views its buying power: not just as a compliance obligation but as a lever for economic policy, sovereign capability, and value delivery. State governments are simultaneously pursuing their own procurement reforms. Defence spending is growing and creating supply chain complexity at a scale not seen in a generation. And the public sector workforce planning and operations challenge is intensifying as government expands into new service delivery models.

This article explains what supply chain transformation in Australian government actually involves, what makes it different from commercial transformation, what the current policy environment means for agencies and their contractors, and how to build programmes that deliver lasting results rather than well-intentioned reports.

Why Government Supply Chain Transformation Is Different

The fundamental difference between supply chain transformation in government and in commercial organisations is not technical — it is contextual. The tools, methodologies, and disciplines are broadly the same. But the environment in which they operate is structured differently in ways that have material consequences for how transformation is designed, executed, and sustained.

The objective function is more complex. Commercial supply chains are ultimately optimised for financial performance — cost, service, working capital. Government supply chains must simultaneously serve efficiency, accountability, equity, social policy, and sovereign capability objectives that can pull in different directions. A procurement decision that is cost-optimal may conflict with Indigenous procurement targets, local content requirements, or SME participation mandates. Understanding how to navigate these competing objectives — rather than treating them as obstacles to optimisation — is a core competence for supply chain transformation in government.

Governance and accountability structures are different. Government procurement operates under the Commonwealth Procurement Rules (CPRs) at the federal level, and equivalent state frameworks at the state and territory level, with oversight from the Australian National Audit Office (ANAO) and parliamentary committees. These governance frameworks create accountability mechanisms that have no direct commercial equivalent. They also create risk aversion — a tendency to default to process compliance over outcome optimisation — that needs to be actively managed in transformation programmes.

The stakeholder landscape is more complex. Government transformation programmes typically involve more stakeholders, with more divergent interests, than commercial equivalents. Program areas, finance, legal, HR, IT, and ministerial offices all have legitimate interests in supply chain decisions. Coordination costs are higher. Alignment is harder to achieve and easier to lose. And the political dimension — the possibility that a transformation programme becomes a political issue — is a real risk that commercial programmes rarely face.

Transformation cycles are longer and more fragile. Government transformation programmes are subject to budget cycles, machinery of government changes, ministerial priorities, and election cycles in ways that commercial programmes are not. A transformation programme that was well-resourced and progressing in one financial year can find itself defunded or deprioritised in the next. The result is accumulated reform fatigue — organisations that have started and not finished multiple transformation programmes develop a healthy scepticism about the next one.

Capability gaps are structural. Commercial organisations can rapidly build supply chain capability through recruitment, because the talent market for supply chain professionals is developed. In government, supply chain and procurement capabilities are often underdeveloped at a structural level — below what the scale and complexity of government spending would warrant — and building capability requires a longer-term investment in people development, not just recruitment.

The Current Policy Environment: What Has Changed

The November 2025 CPR reforms represent the most significant overhaul of Commonwealth procurement rules in nearly a decade. For agencies and contractors alike, understanding what has changed — and what it means operationally — is a practical necessity.

Australian business and SME prioritisation. The revised CPRs require non-corporate Commonwealth entities (NCEs) to invite only Australian businesses to tender for contracts below $125,000 (for non-panel procurement), and only SMEs for Management Advisory Services, People, and DTA panel procurements under that threshold. This is a significant structural shift — it changes the default from open market competition to preferenced competition, and it places an obligation on agencies to actively consider local supplier capacity before going to market.

The threshold increase. The procurement threshold has risen from $80,000 to $125,000 — the first increase in 20 years. This changes the boundary between low-value procurement (which can be done with lighter process) and formal procurement (which requires compliance with the full CPR framework). Agencies need to review their procurement delegations, templates, and processes to ensure they align with the new threshold structure.

Transparency and reporting obligations. From July 2026, AusTender reporting will require agencies to specify why a contract was not awarded to an Australian or New Zealand business where the new preferencing rules apply. This "if not, why not" obligation changes the accountability dynamic for procurement decisions — it is no longer sufficient to make the best commercial decision; agencies must now document the rationale for not preferencing Australian suppliers.

Indigenous procurement targets. The Commonwealth's Indigenous procurement target increased from 2.5% to 3% of total contract value from 1 July 2025, with annual increases of 0.25% until reaching 4% by 2030. Alongside this, new eligibility rules requiring businesses to be at least 51% Indigenous-owned and controlled to qualify under the Indigenous Procurement Policy (IPP) are being introduced from July 2026, addressing the "black cladding" problem that had undermined confidence in the policy.

Ethical and environmental screening. The requirement to make reasonable enquiries into suppliers' compliance with workplace health and safety, environmental impact, and labour regulations now applies to all procurements — not just those above a threshold. This expands the due diligence burden on agencies and creates new requirements for supplier screening processes.

At the state level, procurement reform is equally active. NSW is implementing a minimum 30% weighting for local content, job creation, and ethical supply chain considerations in tender evaluations for procurements exceeding $7.5M. Queensland's Crisafulli government has overhauled the state's $35 billion procurement system with a focus on SME access and Australian-first sourcing. These reforms collectively signal a structural shift in how Australian government — at all levels — views the role of procurement as an instrument of economic and social policy.

What Supply Chain Transformation Looks Like in Practice

Supply chain transformation in Australian government typically encompasses several interconnected workstreams. The mix varies by agency type, sector, and the specific performance problems being addressed.

Procurement Operating Model Reform

For most government agencies, the highest-leverage supply chain improvement opportunity is procurement — both how procurement is structured as a function and how it operates in practice.

Procurement operating model reform typically covers: the organisational design of the procurement function (centralised category management versus decentralised operational procurement versus hybrid models); the operating processes for different procurement types (routine low-value procurement, complex category sourcing, contract management); the capability and skills of the procurement workforce; and the governance frameworks that ensure compliance with the CPRs and agency-specific requirements without creating unnecessary process overhead.

The most common finding in government procurement operating model reviews is that procurement capability is concentrated in a small number of senior people and very thinly spread across the broader workforce. This creates bottlenecks for complex procurements, inconsistent outcomes for routine ones, and limited capacity for the strategic supplier management and market engagement that generate value beyond compliance.

Category Management

Category management — the discipline of managing related spend areas strategically rather than transactionally — is well-established in leading commercial procurement functions and is increasingly being applied in Australian government.

In government, category management typically involves: mapping spend by category across the agency, identifying concentration risk and value leakage, developing category strategies that cover sourcing approach, market engagement, contract structure, and supplier performance management, and establishing governance processes that keep category strategies current and drive compliance.

The CPR reforms make category management more, not less, important. The obligation to consider Australian business and SME participation requires agencies to understand their supply markets well enough to know what Australian and SME supply options exist. That requires market knowledge that cannot be developed transactionally — it requires the kind of sustained market engagement that category management enables.

Supply Chain Operations and Logistics

For agencies that operate physical supply chains — Defence, health agencies, correctional services, emergency management bodies, infrastructure delivery organisations — supply chain operations transformation addresses the logistics infrastructure, inventory management, and service delivery processes that determine whether the right goods reach the right people at the right time.

In government, supply chain operations are frequently underinvested relative to their strategic importance. Defence logistics is the most obvious example — the complexity and criticality of Defence supply chains are not matched by the investment in supply chain capability that those chains warrant. But the pattern is visible across government: fragmented contracts for similar goods, inventory positions that are not optimised, logistics infrastructure that has not kept pace with service delivery model changes.

Operations transformation in government typically involves: spend consolidation (bringing fragmented spend under common category management), contract rationalisation (reducing the number of contracts for similar goods and services), logistics network review (where should stock be held and how should it move), and workforce planning for the supply chain and logistics workforce.

Technology and Data Transformation

Government supply chain systems are often fragmented, legacy-dependent, and poorly integrated — creating data quality problems that undermine decision-making and reporting obligations. Technology transformation in government supply chains typically involves: ERP consolidation or uplift, procurement systems implementation (eProcurement platforms, contract management systems), supply chain visibility tooling, and the data governance frameworks that ensure system investment produces reliable information.

Technology transformation in government is slower and harder than in commercial organisations for structural reasons — procurement cycles for technology are longer, IT governance is more complex, and the risk aversion that permeates government decision-making applies to technology investment as much as anything else. The most effective government technology transformations are the ones that start with clear operating model and process design, then select technology to support defined requirements — rather than starting with a technology platform and redesigning processes to fit it.

Workforce Planning and Capability Uplift

Workforce planning for supply chain and procurement functions in government is an increasingly active concern. The procurement profession within government is facing pressure from multiple directions: the CPR reforms require new skills in market engagement, supplier due diligence, and category management; the digital transformation of procurement processes requires technology literacy that is not uniformly present; and competition for supply chain and procurement talent from the private sector is intensifying.

Workforce planning for government supply chain and procurement involves: demand forecasting for future skill requirements, gap analysis against current capability, recruitment and development strategies, and the organisational design changes that make better use of scarce specialist capability.

Why Transformation Programmes Fail in Government

The failure modes for supply chain transformation in government are distinctive enough to be worth naming explicitly.

Reform fatigue and scope creep. Government agencies frequently launch transformation programmes that are too large, too slow, and too dependent on sustained leadership commitment to survive the inevitable changes in ministerial priorities, budget pressures, and organisational restructuring. Programmes that try to transform everything simultaneously typically succeed at transforming nothing. The most effective government transformations sequence initiatives carefully, deliver early wins that build confidence and momentum, and protect core workstreams from scope expansion.

Process without outcomes. Government procurement transformation programmes frequently produce excellent process documentation, training materials, and policy frameworks — and modest improvement in actual procurement outcomes. Process is necessary but not sufficient. Transformation needs to be anchored to measurable outcomes: cost reduction, savings realised, compliance improvement, capability uplift — and those outcomes need to be tracked and reported through the governance of the programme.

Consulting without embedding. Transformation programmes that are designed and delivered by external consultants without genuine capability transfer to the agency workforce produce dependency, not capability. The programme delivers a design; the agency can't implement or sustain it because the knowledge and skills required to do so remain with the consultants. The most effective programmes build internal capability alongside delivering outcomes — so that the agency is more capable at the end of the engagement than it was at the beginning.

Underestimating change management. Supply chain and procurement transformation in government is change management as much as it is technical improvement. The people who currently do procurement, manage contracts, and run supply chain operations need to work differently — and in some cases, different people need to be doing those roles. Managing that human dimension of transformation — communicating the why, building buy-in, addressing capability gaps, and managing the performance of people who are not adapting — is as important as getting the design right.

How Trace Consultants Can Help

At Trace Consultants, we have deep experience working with Commonwealth and state government agencies on supply chain and procurement transformation — from rapid diagnostics through to multi-year programme delivery. We are a listed provider on multiple Federal and State Government panels, which simplifies and accelerates our engagement process for agencies.

Procurement operating model and CPR compliance. We help agencies assess their current procurement capability and operating model against the requirements of the revised CPRs and their own strategic objectives. We design the organisational structures, processes, and governance frameworks that enable compliant, efficient, and value-generating procurement.

Category management. We design and implement category management frameworks for government agencies — from spend analysis and category segmentation through to category strategy development, market engagement, and supplier performance management. We build the internal capability for category management to be sustained by the agency, not dependent on external support.

Resilience & Risk Management. We help agencies assess and strengthen the resilience of their supply chains — identifying concentration risks, critical dependencies, and the mitigation strategies that protect service delivery. For agencies with DISP obligations and AUKUS-related supply chain requirements, we provide the specialist expertise to navigate those frameworks.

Supply chain operations and logistics. For agencies operating physical supply chains, we assess the operations against best practice and design the improvements that close the gap — whether that is inventory management, logistics network design, contract rationalisation, or warehouse and distribution process improvement. Our Warehousing & Distribution and Strategy & Network Design practices are directly applicable in government contexts.

Strategic Workforce Planning for supply chain and procurement. We help agencies forecast the supply chain and procurement capability they need, assess current-state gaps, and design the workforce development and recruitment strategies that close them. For agencies undergoing significant operating model change, we support the organisational design decisions that determine how supply chain and procurement work should be structured.

Project & Change Management. We manage transformation programmes in government — providing the programme governance, change management, and implementation discipline that keeps complex multi-workstream programmes on track and delivers results against committed timelines and budgets.

Our Government & Defence sector practice brings the deep understanding of public sector governance, accountability, and the specific context of the Australian government operating environment that distinguishes effective government consulting from repackaged commercial methodology.

Explore our Government & Defence capability →

Speak to an expert at Trace →

Getting Started

For most government agencies, the right starting point for supply chain transformation is a structured diagnostic — a rapid assessment of current procurement and supply chain performance against the requirements of the revised CPR framework, current-state capability gaps, and the specific performance problems the agency is experiencing.

That diagnostic typically takes four to six weeks, involves both document review and stakeholder engagement, and produces a prioritised roadmap of improvement initiatives with estimated value, implementation timelines, and resource requirements. It answers the question — what is the highest-value place to start, and what will it take to get there — before commitment to a larger transformation programme.

For agencies facing an imminent CPR compliance review, a contract renewal cycle, or a machinery of government change that is restructuring supply chain and procurement responsibilities, the diagnostic should happen before those events, not after.

The public sector supply chain improvement opportunity is large, the reform environment is active, and the window for agencies that want to get ahead of the compliance and capability requirements rather than react to them is right now.

Explore our Government & Defence capability →

Speak to an expert at Trace →

Strategy & Network Design

Supply Chain Network Design: When and Why to Redesign

Tim Fagan
March 2026
Supply chain networks are not built once and left alone. They drift out of alignment with the business they serve — quietly, gradually, and expensively. Here's how to know when it's time.

Supply Chain Network Design: When and Why to Redesign Your Network

Most Australian businesses are running supply chain networks that were designed for a version of the business that no longer exists. The distribution centre footprint was established when the customer base was different. The transport lanes were set up before e-commerce changed the order profile. The inventory positioning was designed when lead times were shorter and supply was more predictable. The outsourcing decisions were made when labour was cheaper and property was more affordable.

Networks don't fail suddenly. They drift — gradually and quietly — out of alignment with the business they are supposed to serve. Costs creep up. Service levels erode at the margins. The planning team invents workarounds that become permanent. Capacity constraints appear in some nodes while others are underutilised. And at some point, the cumulative effect of years of drift becomes visible in the P&L: logistics costs that are too high relative to revenue, service levels that are persistently below target, and a supply chain that is too slow, too expensive, and too fragile to support the business's growth ambitions.

Network design is the discipline of addressing that drift — of asking whether the current network configuration is still the right one, and if not, what it should look like and how to get there. This article explains what supply chain network design involves, what triggers a redesign, how the process works, and what Australian organisations can realistically expect to achieve.

What Supply Chain Network Design Actually Is

Supply chain network design is the process of determining the optimal structure of a supply chain — the number, location, size, and role of facilities, and the flow of goods between them. It addresses questions like:

Where should warehouses, distribution centres, and fulfilment nodes be located to optimise the cost of reaching customers at the required service levels? How many nodes does the network need — is the current footprint the right size, or is it too large (too many facilities, too much fixed cost) or too small (too much freight cost, too slow to serve regional markets)? What role should each facility play — national distribution centre, state hub, cross-dock, regional spoke, returns processing? How should inventory be positioned across the network to minimise total stockholding cost while maintaining availability? What is the right mix of owned, leased, and third-party logistics infrastructure? And how should the network be configured to balance cost, service, resilience, and sustainability — rather than optimising one dimension at the expense of the others?

Network design is distinct from day-to-day logistics management. It operates at a strategic level, informing decisions that take years to implement, cost significant capital to execute, and shape the supply chain's performance for five to ten years or more. Getting it right matters enormously. Getting it wrong — designing a network around assumptions that prove incorrect, or failing to adapt as conditions change — creates cost and service problems that are difficult and expensive to undo.

Why Networks Drift Out of Alignment

Understanding why supply chain networks become suboptimal over time is the starting point for knowing when and why to redesign.

Business growth and geographic expansion. A network designed to serve a business turning over $200M in revenue from three states will not necessarily perform well when the business reaches $500M and is serving all states and New Zealand. Volume growth strains capacity. Geographic expansion stretches transport lanes. Customer concentration shifts. The network that was right at one scale and geography is simply not the right network at a different scale and geography.

Channel mix change. E-commerce has fundamentally altered the order profile for most Australian retail and FMCG businesses — from full-pallet and full-carton orders shipped to store, to individual item picks shipped to residential addresses. The warehouse design, pick process, labour model, and carrier arrangements optimised for the former are typically wrong for the latter. Channel mix shifts create misalignment between the network as designed and the demand it is actually serving.

Mergers and acquisitions. Post-M&A supply chain integration is one of the most common triggers for network redesign. Combining two businesses typically produces a network with duplicate facilities, overlapping territories, incompatible systems, and a total logistics footprint that is larger than required. Capturing the synergies of a merger requires rationalising the combined network — which is a network design exercise.

Cost environment changes. Logistics costs in Australia have changed materially over the past five years — fuel costs, labour costs in warehousing and transport, industrial property rents in the major capital cities, and sea freight rates have all moved significantly. A network design optimised for the cost structure of 2019 may produce a different answer when reoptimised for 2025 costs. The relative economics of different configurations — more nodes closer to customers versus fewer, larger facilities further away — shift as the cost inputs change.

Lease expiry events. A warehouse lease expiry is one of the most reliable triggers for network review in Australia. It creates a natural decision point — renew, relocate, or redesign — and the cost of signing a new long-term lease on an existing facility that is in the wrong location, the wrong size, or the wrong configuration is very high. Lease events should always be preceded by a network review, not followed by one.

Supply chain disruption and resilience concerns. The events of 2020–2022 exposed the fragility of highly centralised, cost-optimised networks. Organisations that operated single distribution centres, single-source supply arrangements, or geographically concentrated production were disproportionately impacted by port congestion, supplier shutdowns, and freight capacity shortages. Many Australian businesses have since been reviewing their networks specifically to build in resilience — through network decentralisation, additional inventory nodes, or alternative transport routes.

Sustainability and emissions targets. Scope 3 emissions disclosure requirements — now mandatory for eligible Australian entities under the ASIC climate-related financial disclosure regime from January 2025 — are making the emissions profile of logistics networks a financial reporting issue, not just a sustainability aspiration. Freight movements are typically the largest component of a business's Scope 3 logistics emissions. Network designs that minimise freight kilometres, optimise modal mix, and reduce empty running are increasingly evaluated against both cost and emissions criteria simultaneously.

When Is the Right Time to Redesign?

The honest answer is that network design should be a continuous discipline — a periodic review of whether the current network configuration remains optimal, not a once-a-decade project triggered by crisis. In practice, most Australian organisations review their networks reactively rather than proactively, which means they tend to redesign in response to visible pain rather than in anticipation of it.

The clearest signals that a network review is overdue are:

Logistics costs are rising faster than revenue. If freight, warehousing, and handling costs are consuming a growing share of revenue — particularly if this is happening while volume is also growing — the network is likely absorbing inefficiency somewhere. This might be too many nodes creating cross-transfer cost, carrier routes that are inefficient relative to customer concentration, or inventory positions that require excessive replenishment movements.

Service levels are persistently below target. When the supply chain is working hard and DIFOT is still below where the business needs it to be, the problem is often structural — the network is not configured to reach customers within the required timeframes — rather than operational. Operational improvements (faster pick, better transport booking) can recover some performance, but they cannot compensate for a network that is fundamentally in the wrong place relative to demand.

Capacity is the binding constraint. When the answer to operational problems is consistently "we don't have enough space" or "we don't have enough throughput capacity," the conversation shifts from operational improvement to strategic investment. That investment decision — where to add capacity, in what form, at what scale — is a network design question.

A major business change is imminent. New customer contracts, geographic expansion, significant M&A activity, channel strategy changes, or major supplier shifts all change the demand or supply parameters the network needs to serve. The right time to review network design is before those changes take effect, not after the consequences are visible.

The network hasn't been reviewed in five or more years. Even in the absence of obvious pain signals, a network that has not been formally reviewed in five years has almost certainly drifted out of optimality. Business conditions, cost structures, customer expectations, and available logistics infrastructure all change over a five-year horizon. A periodic review — even one that concludes the current configuration is broadly correct — provides the evidence base for that conclusion and identifies incremental improvements that may have accumulated.

How a Network Design Process Works

A well-structured network design process follows a logical sequence from diagnostic through to implementation planning. The time and resource investment scales with the complexity of the network and the scope of the decisions being made, but the core structure is consistent.

Step 1: Define the design problem. Before building any models, establish what question the network design is actually trying to answer. Is this a facilities location exercise — where should nodes be? Is it a make vs. buy question — which activities should be insourced versus third-party? Is it a capacity investment decision — how much space, where, and when? The design problem definition also establishes the design constraints: the service level requirements the network must meet, the cost parameters it must operate within, and the capital available for investment.

Step 2: Gather and validate data. Network design modelling is only as good as the data underpinning it. The minimum data requirement is: customer locations and order profiles (volumes, frequencies, parcel sizes), current facility locations, costs and capacities, freight rates and transit times by lane, and inventory holding data by location and SKU category. In practice, assembling this data from multiple source systems — ERP, WMS, TMS, carrier invoices — is often the most time-consuming part of the process. Data quality issues should be surfaced and resolved before modelling begins, not discovered after scenarios have been built.

Step 3: Model the current state. Build a model that replicates the current network accurately enough to be a reliable baseline. Validate it against actual cost and service data. A model that cannot reproduce current-state costs within an acceptable tolerance cannot be trusted to accurately evaluate future-state scenarios.

Step 4: Develop and evaluate scenarios. The network design process is fundamentally a scenario evaluation exercise. Typically three to five design scenarios are developed — ranging from incremental adjustments to the current network to more radical reconfigurations — and each is evaluated against the design criteria: total cost (logistics, inventory, fixed facility costs), service level performance, capital requirement, implementation risk, and resilience. Scenarios should include sensitivity analysis — testing how the results change if key assumptions (demand growth rate, freight costs, property costs) prove incorrect.

Step 5: Develop the recommended design and implementation roadmap. The recommended design is not just the scenario with the lowest modelled cost — it is the scenario that best satisfies the full set of design criteria given the organisation's strategic priorities and risk appetite. The implementation roadmap translates the recommended design into a sequenced set of actions — facility decisions, lease transactions, systems changes, organisational adjustments — with timelines, capital requirements, and dependencies mapped out.

What Good Network Design Delivers

A well-executed network redesign typically delivers improvement across multiple dimensions simultaneously. Logistics cost reduction of 10–20% is achievable in networks that have not been reviewed recently and have accumulated significant structural inefficiency. Service level improvement — measured in DIFOT, lead time to customers, or reliability of delivery windows — is frequently an outcome alongside cost reduction, because a well-positioned network can reach more customers more reliably than one that has drifted out of alignment with the demand it serves.

Working capital reduction is a third benefit that is often underweighted in network design business cases. Repositioning inventory across the network — concentrating safety stock where it provides the most service benefit and eliminating buffer stock held redundantly across multiple nodes — releases working capital that partially or fully offsets the capital cost of network change.

The resilience benefit is harder to quantify but has become more commercially visible since the supply disruptions of recent years. Networks with greater geographic distribution, multiple transport modes, and strategic inventory positioning are less vulnerable to single-point failure than highly centralised networks optimised purely for cost.

The Australian Context: What Makes Network Design Different Here

Australia's geography creates specific network design challenges that don't apply in the same way in more compact markets.

Population concentration on the eastern seaboard — Sydney, Melbourne, Brisbane, and their surrounds account for the majority of retail consumption — means that for many businesses, the core network design question is how to serve the east coast efficiently while still reaching Perth, Adelaide, Darwin, and regional centres at acceptable cost and service levels.

The distances involved in Australian freight are significant by global standards. Sydney to Perth is over 4,000 kilometres by road. Melbourne to Brisbane is 1,750 kilometres. These distances make transport cost a major variable in network design and create genuine trade-offs between the cost of additional nodes (which reduce freight distance but add fixed facility cost) and the cost of long-haul freight from a centralised network.

Industrial property markets in Sydney, Melbourne, and Brisbane have tightened significantly over the past five years, with vacancy rates at historic lows and rents rising sharply in key logistics corridors. Network designs that were cost-optimal when framed in 2018 or 2019 property terms may produce different answers when current market rents are applied — and property market dynamics need to be explicitly modelled in any current network design exercise.

The Australian logistics infrastructure landscape also shapes network design options: the rail freight network offers cost and emissions advantages for high-volume, long-distance freight but with service and flexibility trade-offs that not all supply chains can absorb; the sea freight lanes between east and west coast ports are a viable cost-effective option for non-time-critical product; and last-mile delivery infrastructure in regional and remote Australia remains more constrained and expensive than in metro markets.

Common Network Design Mistakes

Several failure modes appear consistently in Australian network design projects.

Starting with a site, not a strategy. Organisations that begin a network review with "we need a new warehouse in Melbourne" rather than "what does our network need to look like to support our business strategy" tend to make property decisions that aren't properly anchored in logistics economics. Site selection should be the output of a network design process, not the premise of one.

Optimising for cost alone. Networks designed purely to minimise total logistics cost frequently underperform on service and resilience in ways that create costs elsewhere — lost sales, customer chargebacks, expedited freight. The design criteria need to reflect the full commercial picture.

Using last year's demand. Network designs based on current demand profiles rather than projected future demand build a network for the past, not the future. Design horizon should be at least five years, with sensitivity testing across demand growth scenarios.

Underestimating implementation complexity. A network redesign model that produces a compelling answer on paper can be undermined by implementation challenges: lease break costs, equipment relocation, staff impacts, systems cutover risk, and customer service disruption during transition. Implementation planning is part of the design process, not an afterthought.

Not reviewing as conditions change. A network design completed and implemented is not complete. The business continues to change, costs continue to move, and customer requirements continue to evolve. Building in a regular network review cadence — typically every three to five years for most Australian businesses — ensures the network doesn't drift back out of alignment before the next crisis triggers a reactive review.

How Trace Consultants Can Help

At Trace Consultants, network design is one of our core capabilities. We help Australian organisations answer the hard questions about whether their current network is still the right one — and if not, what it should look like and how to get there.

Strategy & Network Design. We lead end-to-end network design projects — from data gathering and current-state modelling through scenario development, evaluation, and implementation roadmap. We bring the modelling rigour and commercial judgement to translate a design that looks right on a map into one that works in practice.

Lease event and facility decision support. When a lease event, capacity constraint, or facility decision is imminent, we help organisations make it strategically rather than reactively — reviewing whether the current configuration remains appropriate before committing to new long-term property obligations.

Post-M&A network integration. We help organisations rationalise combined networks after acquisition — identifying consolidation opportunities, modelling the cost and service impact of different integration configurations, and planning the transition to avoid customer service disruption.

Resilience & Risk Management. For organisations reviewing their networks specifically through a resilience lens, we assess single-point-of-failure risk, model the cost of resilience investments (additional nodes, strategic inventory positions, alternative transport lanes), and develop network configurations that balance cost efficiency with robustness.

Warehousing & Distribution design. Network design determines where facilities should be; warehousing and distribution design determines what those facilities should look like inside — layout, process design, technology, and automation. We work across both levels.

We have worked across FMCG and manufacturing, retail, health and aged care, property and hospitality, and government and defence. The network design methodology is consistent; the sector context — what service levels are required, what cost constraints apply, what regulatory environment operates — shapes the answer.

Explore our Strategy & Network Design capability →

Speak to an expert at Trace →

The Right Starting Point

If you suspect your network has drifted — if costs are high, service is inconsistent, and the supply chain feels more complicated than it should — the right starting point is a structured current-state assessment. A rapid diagnostic that maps the current network, benchmarks costs and service against industry peers, and identifies the primary misalignments between the network as designed and the business as it operates today.

That assessment typically takes four to six weeks. It produces a clear picture of whether a full network redesign is warranted, what the primary design questions are, and what the realistic improvement opportunity looks like. For organisations facing an imminent lease event or capacity decision, it provides the evidence base to make that decision strategically rather than by default.

Networks built for yesterday's business cost more and deliver less than they should. The question is simply how long to leave it before doing something about it.

Explore our Strategy & Network Design capability →

Speak to an expert at Trace →

Planning, Forecasting, S&OP and IBP

Inventory Optimisation in Australian FMCG and Retail

Most Australian FMCG and retail businesses are carrying too much of the wrong inventory and not enough of the right inventory — often at the same time. Here's how to fix that.

Ask the CFO of any Australian FMCG or retail business what keeps them up at night, and inventory will be on the short list. Too much and working capital is locked on the balance sheet, warehouse space is consumed, and obsolescence risk accumulates. Too little, and stockouts cost sales, damage retailer relationships, and erode customer trust that takes years to build. The cruel irony is that most organisations are simultaneously carrying excess inventory in some categories and running short in others, often for reasons that are hiding in plain sight.

Inventory optimisation is the discipline of resolving that paradox: holding the right stock, in the right locations, at the right times, to service customer demand at an acceptable cost and risk level. It is not about minimising inventory across the board, and it is not about maximising service level regardless of cost. It is about finding the right balance, and that balance looks different for every SKU, every category, and every part of the supply chain.

This article explains how inventory optimisation works in the Australian FMCG and retail context: what drives excess and shortage, how to diagnose where the problem actually lives, what the improvement levers are, and how to build the planning infrastructure that makes performance sustainable rather than dependent on heroic effort.

Why Is Inventory So Hard to Get Right in Australian FMCG?

Inventory is the buffer between supply uncertainty and demand uncertainty. The more uncertain either side of the equation, the more buffer is required to maintain service levels. That basic relationship explains most of the inventory problems Australian organisations face.

End-to-end inventory in FMCG can extend to six months or more. From raw material procurement through manufacturing, warehousing, and distribution to shelf, the total holding across the supply chain is significant. That inventory carries a cost: the cost of capital tied up in stock, warehousing and handling costs, insurance, spoilage and obsolescence risk, and the increasing cost of funding inventory as interest rates remain elevated compared to the near-zero environment of the previous decade.

Australian supply chains also carry structural features that amplify inventory requirements. Long distances between population centres, limited consolidation points relative to the geographic spread of the market, long inbound lead times from offshore manufacturing, and volatile domestic freight conditions all create uncertainty that needs to be buffered with stock. An Australian FMCG business sourcing from Asia with six to ten week lead times and high sea freight variability will carry structurally more inventory than a European equivalent sourcing from a factory two days' drive away. That is not a planning failure. It is geography. But it does mean the other levers matter more.

Promotional activity creates demand spikes that are consistently underplanned. Promotions are a defining feature of the Australian FMCG and grocery retail market, and they are one of the most significant drivers of both stockout and overstock events. Promotions that sell through faster than forecast create stockouts at the shelf and lost sales for both manufacturer and retailer. Promotions that underperform create post-promotional overhang that ties up working capital and risks markdown or obsolescence.

Product proliferation has increased complexity without a corresponding improvement in planning capability. The number of active SKUs in most FMCG businesses has grown substantially over the past decade through range extensions, new product launches, format variants, and channel-specific packaging. Each additional SKU requires its own forecast, its own safety stock calculation, its own replenishment logic. Managing a portfolio of 500 SKUs with the tools and processes designed for 200 produces predictable results.

How Do You Diagnose an Inventory Problem?

Before reaching for improvement levers, it is essential to understand where the inventory problem actually lives. Most organisations have an imprecise diagnosis. They know they have too much inventory, or too many stockouts, or both, but they have not traced the root causes with sufficient precision to target improvement efforts effectively.

A structured inventory diagnostic typically reveals several distinct problem types.

Excess inventory in slow-moving and obsolete stock (SLOB)

In most FMCG businesses, a significant proportion of total inventory value is held in SKUs that are selling slowly, have been superseded by newer products, or are in the tail of a promotional event that did not perform. SLOB inventory is expensive to hold, frequently triggers markdown or disposal costs, and occupies warehouse space that could be used for faster-moving product. Addressing it requires both a tactical clear-down and the upstream process changes that prevent it accumulating again.

Excess safety stock in fast-moving lines

Safety stock set conservatively, because lead times are long, demand variability is high, or planners are simply risk-averse, ties up working capital unnecessarily in lines where it is not needed. When safety stock parameters have not been reviewed since lead times changed or demand patterns shifted, they are often either too high or too low relative to current conditions.

Systematic stockouts in specific SKUs or locations

Stockouts are rarely uniformly distributed. They cluster in specific SKUs, typically high-velocity lines with unpredictable demand, promotional items, or products with irregular supply, and in specific locations, typically the ends of the network or locations with less frequent replenishment cycles. Identifying the concentration of stockout events is the most efficient path to a targeted fix.

Inventory in the wrong location

Stock held centrally when demand is regional, or held in one state distribution centre when demand is spiking in another, creates simultaneous excess and shortage at the aggregate level. Network inventory positioning is a distinct problem from total inventory quantum and requires a different intervention.

Forecast error driving safety stock inflation

Poor demand forecasting is the most common root cause of excess inventory. When forecasts are systematically inaccurate, the natural response is to buffer the uncertainty with more safety stock. The result is that forecast error is converted directly into inventory cost.

What Are the Six Inventory Optimisation Levers?

Improving inventory performance requires working across multiple levers simultaneously. Organisations that pull only one, typically either cutting safety stock or improving forecasting, rarely achieve sustained improvement because the root causes are interconnected.

1. Demand forecasting accuracy

Forecast accuracy is the foundational input to inventory optimisation. Every percentage point improvement translates directly into reduced safety stock requirements and therefore reduced working capital, for the same service level. The highest-value forecasting improvements for most Australian FMCG and retail businesses are not algorithmic. They are process and data improvements: capturing promotional plans accurately and early enough to adjust supply, incorporating retailer POS data into the demand signal rather than relying on orders, improving new product launch forecasting through structured pre-launch processes, and managing end-of-life transitions proactively. Advanced planning systems with machine learning capabilities can deliver further accuracy improvement once the process foundations are in place. Technology applied to broken processes produces bad forecasts faster, not better ones.

2. Safety stock right-sizing

Safety stock exists to buffer demand and supply variability so that stockouts do not occur when forecasts are wrong or supply is delayed. The question is not whether to hold it. It is how much to hold against each SKU, calibrated to the actual variability of demand and supply for that item. Most organisations set safety stock through rules of thumb and inertia. The result is stock that is neither risk-based nor regularly reviewed. Lines where demand has become more predictable are still carrying safety stock set when they were more volatile. A systematic SKU-level review recalibrates settings against current data and typically identifies significant working capital release in lines that are over-buffered and service risk in lines that are under-buffered. The two effects partially offset each other, meaning total inventory can come down while service level goes up.

3. SKU rationalisation

Every SKU carries inventory management overhead: a forecast, a safety stock holding, a replenishment process, warehouse space, and management attention. Low-volume, high-complexity SKUs in the long tail of the range frequently consume a disproportionate share of that overhead relative to the revenue and margin they contribute. SKU rationalisation reduces inventory, simplifies planning, and often improves service on the retained range by concentrating demand onto fewer, better-managed lines. For FMCG manufacturers selling through major retailers, these decisions also involve retailer relationships and ranging agreements, which adds a layer of commercial complexity that needs to be managed carefully.

4. Network inventory positioning

Where inventory is held across the supply chain network has as much impact on working capital and service as how much inventory is held. Centralising inventory reduces total system stock requirements because pooling demand across more locations reduces the variability each location needs to buffer. Decentralising improves proximity to end demand but multiplies safety stock requirements and creates higher risk of stranded stock if demand patterns shift. For FMCG businesses operating through a multi-echelon distribution network, the inventory positioning decision at each echelon has significant working capital implications that are often not fully quantified. Postponement strategies, holding inventory in unfinished or semi-finished form as long as possible before committing to specific SKUs or pack formats, can significantly reduce total inventory requirements in categories with high SKU proliferation and unpredictable mix demand.

5. Supplier lead time and reliability improvement

Lead time and lead time variability are direct inputs to safety stock calculations. Shorter, more reliable lead times require less safety stock for the same service level. Every week of lead time reduction translates into working capital release. For Australian businesses sourcing from offshore manufacturers, this lever is partially constrained by geography. But the non-negotiable geographic component of lead time is worth distinguishing from the manageable operational components: supplier production lead times, order preparation and customs clearance times, freight booking and consolidation practices, and port congestion management. Each is addressable. For domestic suppliers, lead time improvement is more directly achievable through supplier partnership programmes, consignment and VMI arrangements, and collaborative supply planning that gives suppliers better forward visibility of demand.

6. S&OP process integration

Inventory optimisation cannot be sustained without a planning process that integrates demand signals, supply constraints, inventory targets, and commercial decisions into a coherent weekly and monthly cadence. S&OP is that process. When it works well, it connects the commercial team's promotional and ranging plans to supply chain's inventory and replenishment decisions in time to avoid both excess and shortage. The most common S&OP failure mode relevant to inventory is the disconnect between commercial promotion planning and supply chain replenishment. When promotions are confirmed late, communicated to supply chain in insufficient detail, or changed after orders have been placed, supply chain cannot respond in time. Fixing this requires process discipline and cross-functional accountability, not technology.

What Is the Working Capital Case for Inventory Optimisation?

Inventory optimisation is fundamentally a working capital management discipline, and it needs to be framed that way when building the business case for investment.

Reducing inventory by 10 to 20% through the levers above is achievable for most Australian FMCG and retail businesses that have not previously undertaken a structured optimisation programme. For a business carrying $50M in inventory at a 10% cost of capital, a 15% reduction is worth $750K in working capital release and $750K or more in annual carrying cost reduction. That recurs every year.

The service level improvement case is equally important. Stockouts have a direct P&L impact through lost sales, promotional redemption shortfalls, and retailer chargebacks, as well as a longer-term relationship cost that is harder to quantify but real. Presenting inventory optimisation as a programme that simultaneously releases working capital and improves service levels, rather than trading one against the other, is the commercial framing that lands with CFOs and CEOs.

What Does Sustainable Inventory Performance Actually Require?

The fundamental mistake in most inventory improvement programmes is treating inventory as a problem to be solved once rather than a performance dimension to be managed continuously. Inventory balances change every day. Demand patterns evolve. New products launch and old ones die. Supplier performance varies. An inventory position that was right six months ago may be wrong today.

Sustainable performance requires the right planning parameters reviewed and updated regularly, not set and forgotten. It requires the planning capability, in people, process, and systems, to translate current demand signals into accurate replenishment decisions. It requires a governance cadence that reviews inventory performance and acts on exceptions. And it requires cross-functional alignment that prevents commercial decisions from blindsiding supply chain.

For many Australian FMCG and retail businesses, the biggest gap is not the methodology. It is the planning capability required to execute it consistently. Investing in that capability is what separates organisations that achieve lasting improvement from those that run a project, see a temporary improvement, and then watch inventory creep back up.

How Trace Helps Australian Businesses Optimise Inventory

Trace Consultants works with Australian FMCG and retail businesses to diagnose and systematically improve inventory performance, reducing working capital, improving service levels, and building the planning capability that sustains the improvement. Our practitioners have run inventory improvement programmes across grocery, retail, manufacturing, and distribution, which means the recommendations we make are grounded in what actually works in the Australian market, not what works in theory.

Inventory diagnostic and opportunity quantification

We conduct structured diagnostics that identify where excess and shortage are concentrated, quantify the working capital and service opportunity, and prioritise improvement initiatives by impact and feasibility. The output is a clear, actionable improvement roadmap with a financial case attached.

Safety stock and parameter review

We review safety stock settings, reorder points, and replenishment parameters at the SKU level, recalibrating them against current demand and supply variability data. For businesses that have not reviewed planning parameters systematically, this exercise typically identifies significant working capital release opportunity.

Planning and Operations process design

We design and implement the S&OP and demand planning processes that keep inventory performance on track, including cross-functional governance, promotional planning integration, and new product and end-of-life management. Explore our Planning and Operations services.

Network inventory positioning

We assess inventory positioning across distribution networks and identify rebalancing opportunities where centralisation, decentralisation, or postponement strategies can reduce total system inventory while maintaining or improving service.

SKU rationalisation

We support structured SKU rationalisation analysis, building the commercial and supply chain case for range simplification decisions and managing the transition to avoid service disruption during delisting.

Technology selection and APS support

For organisations where planning system capability is a constraint, we support advanced planning system selection and implementation, independently and without vendor alignment, ensuring the technology investment is matched to actual planning process requirements. Explore our Technology services.

We work across FMCG and manufacturing, retail, health and aged care, and property and hospitality. The inventory optimisation challenge presents differently across these sectors. The disciplines that solve it are consistent.

Explore our Planning and Operations capability →

Speak to an expert at Trace →

Where Should You Start With Inventory Optimisation?

The right starting point is a structured diagnostic, not a technology purchase, not a headcount reduction in the planning team, and not a blanket instruction to cut stock by 20%.

A diagnostic takes four to eight weeks. It produces a quantified picture of where the inventory problem lives and what is causing it, and generates a prioritised action plan. It typically reveals more opportunity than expected, and it provides the evidence base to build a business case that gets executive commitment to the investment required for sustained improvement.

If the balance sheet is carrying more inventory than it should, if stockouts are costing sales you can ill afford to lose, or if the planning team is working harder than ever without improving the numbers, a diagnostic is where to start.

Frequently Asked Questions About Inventory Optimisation

What is inventory optimisation?Inventory optimisation is the discipline of holding the right stock, in the right locations, at the right times, to service customer demand at an acceptable cost and risk level. It is not about minimising inventory across the board or maximising service level regardless of cost. It is about finding the right balance for every SKU, every category, and every part of the supply chain.

What is the most common cause of excess inventory in Australian FMCG?

Poor demand forecasting is the most common root cause. When forecasts are systematically inaccurate, the natural response is to buffer the uncertainty with more safety stock. The result is that forecast error is converted directly into inventory cost. The highest-value fixes are usually process and data improvements rather than algorithmic ones: capturing promotional plans accurately and early, incorporating retailer POS data into the demand signal, and managing new product launches and end-of-life transitions proactively.

How much working capital can inventory optimisation release?

For most Australian FMCG and retail businesses that have not previously undertaken a structured optimisation programme, reducing inventory by 10 to 20% is achievable. For a business carrying $50M in inventory at a 10% cost of capital, a 15% reduction is worth $750K in working capital release and $750K or more in annual carrying cost reduction.

Can you improve service levels and reduce inventory at the same time?

Yes, and this is one of the most important points to make when building the business case internally. A systematic safety stock review typically identifies lines that are significantly over-buffered and lines that are under-buffered. Recalibrating both simultaneously means total inventory can come down while service level goes up. The two objectives are not in conflict when the starting point is a proper diagnosis.

What is the difference between safety stock and cycle stock?

Cycle stock is the inventory that is consumed and replenished in the normal order cycle. Safety stock is the additional buffer held to cover variability in demand and supply. Both contribute to total inventory. Cycle stock is reduced by ordering more frequently in smaller quantities. Safety stock is reduced by improving forecast accuracy, reducing lead time variability, and right-sizing parameters at the SKU level.

How does S&OP connect to inventory performance?

S&OP is the planning process that integrates demand signals, supply constraints, inventory targets, and commercial decisions into a coherent operating rhythm. When it works well, it connects promotional and ranging plans to inventory and replenishment decisions in time to avoid both excess and shortage. The most common inventory failure mode connected to S&OP is the disconnect between commercial promotion planning and supply chain replenishment: when promotions are confirmed late or changed after orders have been placed, inventory failure is the inevitable result.

Supply Chain Project Management

DIFOT: What It Is and How to Improve It

Most Australian organisations track DIFOT. Far fewer measure it correctly, understand what's actually driving it, or know how to improve it in a way that sticks.

DIFOT: What It Is, How to Measure It, and How to Improve It

DIFOT — Delivered In Full, On Time — is one of the most widely used metrics in Australian supply chain management. It appears on almost every logistics dashboard, features in almost every supplier contract, and gets cited in almost every supply chain review. It is also one of the most frequently misunderstood, inconsistently defined, and poorly acted upon metrics in the business.

Organisations that track DIFOT as a headline percentage and congratulate themselves when the number looks good are missing the point. A DIFOT score tells you whether your supply chain is delivering on its promises. It does not tell you why it isn't, where the failures are concentrated, who is accountable for them, or what to do differently. Getting genuine value from DIFOT requires more than tracking it — it requires defining it properly, measuring it accurately, diagnosing what's underneath the number, and building the management discipline to drive systematic improvement.

This article covers all of it: what DIFOT is and how it differs from related metrics, how to define and calculate it in a way that is actually meaningful, what Australian benchmarks look like, the most common root causes of poor DIFOT performance, and the practical improvement levers that produce results.

What DIFOT Actually Measures

DIFOT measures the percentage of deliveries that arrive at the customer's location complete and on time. It combines two distinct performance dimensions into a single metric.

In Full means the entire ordered quantity was delivered. A shipment that arrives with 95 units when 100 were ordered is not delivered in full, regardless of when it arrived. Even a single unit short is a failure against the in-full component.

On Time means the delivery arrived within the agreed timeframe. What "agreed" means varies — it might be the original customer requested date, the committed delivery date confirmed by the supplier, or the scheduled delivery appointment. The definition matters, and it needs to be explicit.

DIFOT is only satisfied when both conditions are met simultaneously. A complete order that arrives late fails. An on-time delivery that is short fails. Only deliveries that are both complete and on time count as a DIFOT success.

The formula is straightforward:

DIFOT (%) = (Number of orders delivered in full and on time ÷ Total number of orders) × 100

So if a supplier delivers 920 orders in full and on time out of 1,000 total orders in a given period, DIFOT is 92%.

DIFOT vs. Related Metrics

DIFOT is an Australian and New Zealand term. In other markets — particularly the US and UK — the equivalent metric is typically called OTIF (On Time In Full). The two terms measure the same thing and can be used interchangeably. Australian organisations working with international supply chain partners or benchmarking against global data will encounter OTIF more frequently than DIFOT.

It is also worth distinguishing DIFOT from two narrower metrics that sometimes get conflated with it:

Shipped On Time (SOT) measures whether orders were dispatched by the committed ship date — but says nothing about whether the order was complete or whether it arrived when the customer needed it. An order can be shipped on time and arrive late, particularly when carriers underperform or transit times are miscalculated.

On Time Delivery (OTD) measures whether deliveries arrived on time, but does not require the order to be complete. An order can arrive on time and still fail DIFOT because it was short.

DIFOT is the more demanding standard — and therefore the more useful one. It holds the entire fulfilment process accountable, not just the dispatch or the transit leg.

Why DIFOT Definition Matters More Than People Think

The most common DIFOT measurement problem in Australian organisations is not a calculation error — it is definitional ambiguity that makes the metric meaningless or, worse, misleading.

What counts as "on time"? If on time is measured against the original customer requested date, DIFOT will typically look worse than if it is measured against the committed delivery date — because supply chains routinely negotiate delivery dates after the original order is placed. Neither definition is wrong, but they measure different things. The customer requested date measures how well the supply chain responds to actual customer need. The committed delivery date measures whether the supply chain delivers against its own commitments. Both are valid. The problem is when organisations measure against committed dates (which they control) but present the result as if it reflects customer experience.

What counts as "in full"? Is a delivery in full if it contains 99% of the ordered quantity? 95%? Does it depend on whether the shortage is on a critical line item or a low-priority SKU? Many organisations define "in full" at the order level rather than the line level, which can mask significant fulfilment gaps. A better approach defines in-full at the line level, so that a partial delivery of any line fails the in-full test.

Who is measuring against what? Supplier-reported DIFOT and customer-measured DIFOT frequently diverge — sometimes materially. A supplier who measures DIFOT at the point of dispatch will report higher numbers than a customer who measures at the point of receipt. The gap between the two reflects transit failures, carrier damage, receiving discrepancies, and misaligned timing definitions. Both measurements have value, but they need to be understood as measuring different things.

How is the measurement period defined? DIFOT calculated weekly, monthly, and quarterly will produce different trend pictures depending on seasonal patterns and the lag between orders and deliveries. The measurement period needs to match the decision-making rhythm of the business.

These definitional choices need to be made explicitly, documented, and agreed between supply chain partners before DIFOT is used as a performance management tool. Without that foundation, DIFOT becomes a source of commercial dispute rather than a driver of improvement.

What Good DIFOT Looks Like in Australia

Australian benchmarks for DIFOT vary by sector, channel, and supply chain complexity, but the following ranges provide a useful orientation.

A DIFOT score above 95% is generally considered the baseline expectation for competent performance in most Australian supply chains. World-class performers — typically organisations with mature demand planning, disciplined supplier management, and well-designed logistics networks — operate in the 97–99% range.

Scores below 90% indicate systemic problems. Scores consistently below 85% indicate that the supply chain is structurally broken in one or more significant ways.

Sector context matters significantly. Fresh food and perishable supply chains operate under time constraints that make DIFOT failure more consequential than in ambient or durable goods supply chains — a late delivery of fresh produce is often also an unusable delivery. Healthcare supply chains, particularly in hospitals and aged care, carry safety implications for DIFOT failure that go beyond commercial impact. Retail supply chains with large promotional volumes have DIFOT peaks that look very different from their everyday performance.

The relevant benchmark is not a generic industry average — it is the DIFOT performance of your best comparable peers, measured the same way you measure it. That requires either industry benchmarking data or the willingness to have direct conversations with peer organisations about how they measure and what they achieve.

Why DIFOT Fails: The Root Cause Landscape

DIFOT is an output metric. A poor DIFOT score tells you the supply chain failed to deliver — it does not tell you why. Understanding the root causes of DIFOT failure requires drilling beneath the headline number into the components of the fulfilment process.

The root causes cluster into several categories.

Demand and Order Management

Poor demand forecasting creates supply shortages that directly cause in-full failures. If the supply chain does not know what is coming, it cannot prepare to fulfil it. Demand volatility, promotional uplift that is not communicated to suppliers, and last-minute order changes all create in-full risk.

Order entry errors — wrong quantities, wrong SKU codes, wrong delivery addresses — create both in-full and on-time failures. These errors are often blamed on customers but are frequently a symptom of order management systems that make mistakes easy and difficult to catch.

Inventory and Supply Planning

The most common cause of in-full failure is insufficient stock availability at the time of order fulfilment. This can result from inadequate safety stock settings, poor replenishment triggers, supplier lead time variability that is not accounted for in planning parameters, or demand peaks that exceed forecast.

Inventory accuracy is also a significant contributor. A warehouse system that shows 500 units available when the physical count is 450 will generate in-full failures at the point of pick. Inventory accuracy below 99% is a persistent source of DIFOT degradation in warehouse environments.

Warehousing and Fulfilment

Picking errors — selecting the wrong SKU, wrong quantity, or wrong batch — directly cause in-full failures. The rate of picking error is a function of warehouse layout design, pick instruction quality, scanning compliance, and operator training. Warehouses operating without barcode scanning or voice-directed picking at scale will typically have higher error rates than those with systematic verification.

Loading errors — putting the right pick into the wrong vehicle or the wrong delivery slot — create on-time failures even when pick accuracy is perfect. Loading validation processes and load confirmation steps in the WMS are the control mechanism here.

Transport and Carrier Performance

Carrier failures are an obvious cause of on-time DIFOT failures, but they are often less significant than internal causes. Most Australian organisations that investigate their DIFOT failures carefully find that the majority originate inside their own operations — in demand planning, inventory management, or warehouse operations — rather than in the transport leg.

That said, carrier performance matters. Transit time reliability, last-mile execution, appointment adherence at customer receiving docks, and carrier communication when delays occur all affect DIFOT. Carrier performance needs to be tracked separately from internal performance, using consistent data, so that accountability is correctly attributed.

Supplier Performance

For organisations managing inbound supply chains — manufacturers buying raw materials, distributors buying finished goods from suppliers — supplier DIFOT is the upstream input that constrains downstream customer DIFOT. A supplier who delivers late or short creates a ripple that eventually reaches the end customer.

Supplier DIFOT tracking is a prerequisite for supplier accountability. Without it, supply chain managers are responding to symptoms rather than causes.

The Measurement Infrastructure DIFOT Requires

Accurate DIFOT measurement requires data from multiple systems, and most organisations underestimate the data quality work required to produce a DIFOT number they can actually trust.

The minimum data requirements are: order quantity (what was ordered), delivered quantity (what was actually received), order date (when was it placed), required delivery date (when did the customer need it), and actual delivery date (when did it arrive). All of these need to be captured consistently, at the line level, and linked across the fulfilment process.

In practice, this means integration between order management systems, warehouse management systems, and transport management systems — and ideally, confirmation data from the customer's receiving system. In many Australian organisations, this data exists in fragments across multiple systems that don't talk to each other, which is why DIFOT is frequently calculated manually from spreadsheet extracts rather than generated automatically from integrated systems.

The investment in building proper DIFOT measurement infrastructure — data integration, automated calculation, and line-level visibility — consistently pays back in the improvement it enables. You cannot manage what you cannot accurately measure, and you cannot accurately measure DIFOT from a monthly spreadsheet reconciled after the fact.

How to Actually Improve DIFOT

Improving DIFOT requires a structured diagnosis before a solution. The organisations that achieve sustained DIFOT improvement are the ones that invest in understanding where their failures are concentrated — by supplier, by SKU, by customer, by day of week, by distribution centre — before they decide what to fix.

Step 1: Segment the failures

A DIFOT score of 92% contains multitudes. Are the 8% of failures concentrated in a handful of suppliers? In one distribution centre? On specific SKUs that are chronically short? In deliveries to specific customer locations with tight receiving windows? On Mondays after weekend promotions? The answer determines the intervention.

Segmenting DIFOT failures by root cause category — demand/order management, inventory, warehouse, transport, supplier — is the most useful first cut. It tells you where to direct improvement effort and prevents the common mistake of applying transport solutions to what is fundamentally an inventory problem.

Step 2: Fix the measurement before fixing the metric

If DIFOT is measured inconsistently, fixing the supply chain will not reliably improve the number. Organisations often spend months on operational improvement initiatives only to find the DIFOT headline barely moves — because the measurement methodology has significant gaps or inconsistencies that absorb real improvement without reflecting it in the number. Clean the measurement first.

Step 3: Build supplier accountability

Supplier DIFOT tracking, with regular formal reviews, performance targets embedded in commercial agreements, and clear escalation processes for persistent underperformance, is the most effective single lever for improving inbound supply reliability. Suppliers who know they are being measured and held accountable perform differently from those who are not.

The cadence matters. Monthly supplier reviews are too infrequent to catch and correct developing problems before they become DIFOT failures. Weekly DIFOT reporting with exception escalation for suppliers below threshold allows problems to be identified and actioned before they flow through to customer impact.

Step 4: Improve demand signal quality

Better forecasts reduce in-full failures caused by inventory shortages. The improvement actions depend on what is driving forecast error — whether it is promotional planning gaps, customer ordering variability, product mix shifts, or demand sensing capability. In most FMCG and retail supply chains, improving the quality of promotional demand communication from commercial teams to supply chain is the highest-value forecasting improvement available.

Step 5: Tighten inventory parameters

Safety stock settings that were calibrated for historical lead time and demand variability need to be recalibrated when those parameters change. In many Australian supply chains, safety stock settings have not been reviewed since the supply disruptions of 2020–2022 changed lead time profiles — and they are either too high (tying up working capital) or too low (creating availability risk). A systematic review of safety stock settings against current lead time and demand variability data typically identifies meaningful in-full improvement opportunity.

Step 6: Improve warehouse execution quality

Picking accuracy improvement in warehouse operations is usually a process and technology question, not a people question. Implementing or improving barcode scanning compliance, adding verification steps before despatch, and reviewing pick path and slotting design are all levers that reduce warehouse-originated DIFOT failures. The priority actions depend on where the errors are occurring and at what rate.

Step 7: Embed DIFOT in governance

DIFOT improvement does not stick if it is a project. It sticks when it is embedded in the regular management cadence — weekly operational reviews that flag exceptions against target, monthly performance discussions with suppliers, and a clear escalation path when DIFOT drops below threshold. The governance design needs to be clear about who owns DIFOT, who owns each root cause category, and what the response protocol is when performance falls below the line.

The DIFOT–Working Capital Trade-off

One of the most important and frequently misunderstood relationships in supply chain management is the trade-off between DIFOT and working capital. The blunt instrument for improving DIFOT is to carry more inventory — more safety stock, more buffer stock at distribution centres, more finished goods against which to fulfil orders. It works, up to a point, but it is expensive.

The disciplined path to DIFOT improvement reduces the need for inventory buffer by improving the accuracy and reliability of the supply chain itself — better demand signals, shorter and more reliable lead times, more accurate supplier performance, lower warehouse error rates. When those improvements are achieved, DIFOT goes up and inventory comes down. That is the supply chain improvement equation that creates real commercial value.

CFOs who are asked to fund DIFOT improvement initiatives should expect to see a working capital benefit projection alongside the service level improvement projection. If the business case only shows DIFOT going up without inventory coming down, the improvement is being achieved through buffer accumulation, not genuine supply chain capability uplift.

How Trace Consultants Can Help

At Trace Consultants, we help Australian and New Zealand organisations design, measure, and systematically improve DIFOT performance — across inbound supplier networks, internal fulfilment operations, and outbound customer delivery.

DIFOT diagnostic and root cause analysis. We conduct structured DIFOT diagnostics that move beyond the headline number to identify where failures are concentrated, what is causing them, and what improvement is realistically achievable. The diagnostic provides a prioritised action plan, not just a problem list.

Measurement framework design. We help organisations define DIFOT in a way that is commercially meaningful, technically accurate, and consistent across their supply chain partners — eliminating the definitional ambiguity that makes DIFOT a source of dispute rather than improvement.

Planning & Operations improvement. For organisations where DIFOT failures are driven by demand planning, inventory management, or supply planning gaps, we design and implement the planning process improvements that address root causes rather than symptoms.

Supplier performance management. We design the supplier DIFOT tracking frameworks, scorecard structures, and governance processes that create genuine supplier accountability — and support the commercial conversations required to embed DIFOT targets in supplier agreements.

Warehouse and fulfilment optimisation. For operations where warehouse execution is a significant DIFOT failure driver, we assess warehouse process design, technology utilisation, and quality control mechanisms and implement the changes that reduce error rates and improve throughput reliability. Our Warehousing & Distribution practice has extensive experience across distribution centres, 3PL operations, and in-house fulfilment environments.

Technology assessment and implementation support. Where DIFOT measurement or improvement requires system capability that the organisation currently lacks — WMS functionality, TMS visibility, demand planning tooling — we support technology selection and implementation in a way that is independent of vendor relationships.

We work across FMCG and manufacturing, retail, health and aged care, property and hospitality, and government and defence. The DIFOT challenge presents differently in each sector — the underlying disciplines that solve it are consistent.

Explore our Planning & Operations capability →

Speak to an expert at Trace →

The Bottom Line

DIFOT is the supply chain's report card. A high score means the business is delivering on its promises to customers. A low score means it isn't — and somewhere in the supply chain, there are root causes that haven't been properly diagnosed or addressed.

Getting DIFOT right is not complicated, but it requires discipline: define the metric clearly, measure it accurately, segment the failures rigorously, fix the root causes systematically, and manage it in the ongoing governance of the business. Organisations that do this consistently find that DIFOT improves, working capital comes down, and the commercial relationship with customers strengthens.

The organisations that don't — that track the number, shrug at the result, and wait for things to improve — tend to find that they don't.

Explore our Planning & Operations capability →

Speak to an expert at Trace →

Asset Management and MRO

Supply Chain Security for Australian Defence Contractors

Mathew Tolley
March 2026
AUKUS, the Essential Eight, and growing sovereign capability requirements are raising the bar for every Australian business in the defence supply chain. Here's what it means in practice.

Facilities Management Procurement: How to Structure and Tender FM Contracts in Australia

Facilities management is one of the largest and most consistently mismanaged spend categories in Australian organisations. For a hospital, an integrated resort, a government agency, or a large commercial property portfolio, FM spend — covering mechanical and electrical maintenance, cleaning, security, waste management, catering, and building services — can easily reach tens of millions of dollars annually. It sits in almost every organisation's top five spend categories. It receives a fraction of the procurement rigour applied to direct materials or major capital works.

The result is predictable. Contracts that were competitive at award drift over time as providers build margin into variations, embed cost escalation mechanisms that exceed CPI, and reduce service delivery quality once the relationship is established and switching costs are high. Specifications that were written for a building that no longer exists. KPIs that measure activity rather than outcomes. Contract management that is reactive rather than proactive. And a renewal process that defaults to incumbent re-appointment because running a proper market process feels too hard.

This article explains how to run FM procurement properly — how to structure the contract model, specify requirements in a way that drives competitive tension and performance, run a rigorous tender process, and manage the resulting contracts to capture the value the process was designed to deliver.

What FM Procurement Actually Covers

Facilities management procurement encompasses two broad categories of service, and understanding the distinction matters for how you structure contracts and go to market.

Hard FM covers the maintenance and management of physical building systems and infrastructure: mechanical, electrical, plumbing, and fire (MEP/F) maintenance; HVAC; lifts and escalators; building management systems (BMS); and statutory compliance testing. Hard FM work is typically asset-intensive, requires licensed tradespeople, and has a significant planned preventative maintenance (PPM) component alongside reactive and corrective work.

Soft FM covers services that support building occupants rather than building systems: cleaning, security, waste management, catering, landscaping, pest control, and reception or concierge services. Soft FM is typically labour-intensive, has lower technical barriers to entry, and is a more competitive market than hard FM in most Australian locations.

The strategic question at the start of any FM procurement process is how to bundle or separate these services — whether to go to market for an integrated facilities management (IFM) arrangement with a single provider managing the full scope, or to run separate procurement exercises for hard FM, soft FM, and potentially individual service lines within those categories.

Bundled vs. Unbundled: Getting the Contract Structure Right

The bundling decision is the single most consequential structural choice in FM procurement, and there is no universally correct answer. The right structure depends on the complexity of the portfolio, the organisation's contract management capability, and the depth of the market for the services in question.

Integrated FM (single provider) reduces contract management overhead and creates clear accountability — one provider owns the outcome, not individual services. It suits organisations with limited internal FM expertise, geographically dispersed portfolios, or a strategic preference for a single relationship. The trade-off is market risk: the pool of credible IFM providers in Australia is relatively shallow, bundling typically reduces competitive tension on individual service lines, and IFM providers routinely subcontract soft FM services, adding a margin layer that direct procurement would eliminate.

Bundled hard FM / separate soft FM is the most common structure for mid-to-large Australian organisations. It concentrates the technically complex work — MEP maintenance, statutory compliance, BMS — with a specialist hard FM provider, while running separate (and often more competitive) procurement for cleaning, security, and waste. This structure provides better market access for each service category while keeping the number of contracts manageable.

Fully unbundled — separate contracts for each service line — maximises competitive tension and eliminates subcontractor margin, but creates significant contract management complexity. It suits organisations with mature FM procurement functions, large portfolios with genuine scale in each service category, and the internal bandwidth to manage multiple provider relationships.

A fourth option, increasingly used by large property owners and operators, is the managing agent model — where a specialist FM consultant or managing agent is appointed to manage the supply chain on behalf of the owner, with service providers contracted directly. This model is particularly relevant for organisations that want the accountability of integrated FM without committing to a single IFM provider.

Specifying Requirements: Output vs. Outcome

The most common failure in FM tender documentation is over-specifying inputs and under-specifying outcomes. A specification that prescribes exactly how many cleaners should be on site, what hours they work, and what tasks they perform on each day of the week is a task-based specification. It tells providers how to deliver the service, not what the service needs to achieve — and it eliminates the provider's ability to innovate, substitute technology for labour, or optimise their delivery model to reduce cost.

Outcome-based specifications define what the end state should be — "the facility will be maintained at Condition Grade B or better across all asset categories" or "all statutory compliance testing will be completed within scheduled intervals with zero overdue items" — and leave the method to the provider. This approach drives genuine competition on delivery model and commercial efficiency, not just on headcount rates.

In practice, the best FM specifications blend both approaches. Critical compliance and safety obligations — statutory inspection frequencies, licensing requirements, response time requirements for emergency reactive work — are specified as mandatory process requirements. Service quality outcomes — cleanliness standards, asset condition targets, occupant satisfaction metrics — are specified as measurable outputs. How the provider achieves those outputs is their problem to solve.

Asset data is the foundation of a good specification. A specification for hard FM maintenance is only as credible as the asset register underpinning it. If the organisation doesn't know what assets it has, where they are, what their condition is, and when they were last serviced, providers will price in risk — and they should. A pre-tender asset audit, even a rapid one, almost always pays for itself in reduced risk contingency pricing.

Pricing Models: Getting Commercial Incentives Right

FM contracts can be priced in multiple ways, and the pricing model determines where the commercial risk sits and what behaviour it incentivises.

Lump sum / fixed price provides cost certainty but requires a very well-specified scope. Any gap in the specification becomes a variation. Providers who price lump sum on a poorly specified scope will either win at an artificially low price and then recover through variations, or price at a premium that reflects the uncertainty. Lump sum pricing works best for soft FM services where the scope is relatively predictable.

Schedule of rates prices individual units of work — labour hours by trade and grade, materials at cost plus margin, reactive callout fees — and the total contract value depends on actual consumption. This model provides flexibility and transparency but transfers volume risk to the client. Schedule of rates is appropriate for reactive maintenance where work scope is inherently variable.

Hybrid pricing — lump sum for planned preventative maintenance, schedule of rates for reactive and project work — is the most common model for hard FM and typically provides the best balance of cost certainty and flexibility.

Gainshare / performance-linked pricing ties a component of provider remuneration to measurable performance outcomes. This model is more sophisticated to design and administer but aligns provider incentives with client outcomes in a way that fixed-price models don't. It is increasingly used in large, long-term FM contracts where the organisation wants to create a genuine commercial incentive for performance improvement over time.

Running the Tender Process

A well-run FM tender process follows a structured sequence that most Australian organisations compress or skip entirely.

Market engagement before the RFP. Before issuing formal tender documents, engage the market. Run an Expression of Interest or industry briefing to test the appetite of credible providers, understand market capacity constraints, and gather input on specification approach. Providers who have contributed to the specification design are more likely to submit competitive, well-reasoned bids. Market engagement also signals to the provider community that this is a serious procurement — which affects the quality of resources providers allocate to bidding.

RFP documentation that is complete and coherent. The single biggest determinant of bid quality is the quality of the tender documentation. Incomplete asset data, ambiguous scope, inconsistent pricing schedules, and unrealistic mobilisation timelines all reduce the quality of bids and increase the risk premium providers embed in their pricing. The RFP should include: a complete scope of services, the asset register, historical spend and volume data, the pricing schedule, the draft contract, the evaluation criteria and weightings, and a realistic timeline.

Site visits as a mandatory tender step. For hard FM and IFM tenders, require all shortlisted providers to conduct a site visit before submitting their bid. A provider who has walked the assets, understood the building systems, and assessed the condition of the portfolio will price more accurately than one working from documents alone. Accurate pricing reduces variation risk after contract award.

Evaluation that weights more than price. FM contracts are long-term service relationships. A provider who wins on price and underdelivers on service quality is not a good procurement outcome — and the cost of re-tendering within 12 months is significant. The evaluation scorecard should weight technical capability, delivery model, mobilisation plan, subcontractor management, and reference checks alongside commercial pricing. For hard FM in particular, the licensing, compliance, and safety credentials of the bidding entity should be a gate criterion before the commercial evaluation begins.

Reference checks with comparable clients. Always check references — and do it properly. A phone conversation with a peer organisation running a similar portfolio is worth more than any written reference. Ask specifically about variation rates, response time performance, staff turnover, and how the provider manages relationship issues. These are the things that determine what it is like to actually work with a provider, as distinct from what they put in a tender submission.

Contract Management: Where FM Value Is Won or Lost

A well-run tender process that produces a well-structured contract is only half the work. The other half is contract management — and it is where most Australian organisations leave the most value on the table.

FM contract management requires three things: performance measurement against the KPIs specified in the contract, a governance cadence that creates structured visibility and accountability, and a commercial discipline around variations and cost escalation.

KPIs need to be measurable and measured. KPIs that exist in the contract but are never tracked are not KPIs — they are aspirations. The KPI framework should be built around data the provider is required to report, on a defined schedule, in a defined format. Organisations that rely on providers to self-report without independent verification will consistently receive optimistic data.

Planned preventative maintenance compliance is the leading indicator. For hard FM, PPM compliance — the percentage of scheduled maintenance tasks completed on time and to specification — is the most important leading indicator of asset condition and statutory compliance risk. An FM provider who is consistently behind on PPM is creating deferred maintenance liability that will crystallise as emergency reactive work, equipment failure, or compliance breach. Monitor it monthly. Act on it early.

Manage variations actively. In a poorly managed FM contract, variations become a profit recovery mechanism for providers who priced aggressively to win the work. Every variation request should be assessed against the specification to determine whether it genuinely falls outside scope. Variations that are in scope should be rejected. Variations that are legitimate should be priced against the schedule of rates in the contract, not negotiated from scratch.

Benchmark before renewal. Before re-tendering or renewing an FM contract, benchmark the incumbent's pricing and performance against current market rates. FM markets move. The rates that were competitive four years ago may not be competitive today — in either direction. An independent benchmarking exercise, conducted 12–18 months before contract expiry, gives the organisation the evidence base to negotiate effectively or to run a genuinely competitive tender.

How Trace Consultants Can Help

At Trace Consultants, we help Australian organisations structure, tender, and manage FM contracts that deliver genuine value — not just at award, but over the life of the relationship.

FM procurement strategy and contract structure. We advise on the optimal bundling strategy for your portfolio — whether IFM, bundled hard/soft FM, or fully unbundled — based on your portfolio complexity, internal capability, and market context. We design the pricing model, KPI framework, and contract structure before the tender process begins.

Procurement process management. We design and run the end-to-end tender process — specification development, RFP documentation, market engagement, site visit coordination, bid evaluation, and contract negotiation. We manage the process so your team doesn't have to, while ensuring you maintain commercial control of the outcome.

Specification development and asset data. For hard FM tenders, we support the asset data preparation that underpins a credible specification — rapid asset condition assessments, PPM schedule development, and statutory compliance gap analysis. We ensure providers are pricing against accurate data, not protecting themselves against uncertainty.

Benchmarking and incumbent review. We benchmark FM contracts against current market rates and performance data, providing the evidence base for renewal negotiations or the decision to re-tender. For organisations questioning whether their current FM arrangements are delivering value, a benchmarking exercise is typically the right starting point.

Contract management frameworks. We design the governance, reporting, and performance management frameworks that make FM contracts deliver what they promised — including KPI dashboards, variation management protocols, and escalation mechanisms.

We work across property, hospitality, and integrated resorts, health and aged care, government and defence, and retail. The FM procurement challenge is consistent across sectors. The scale, complexity, and regulatory context differ — and that's where sector experience matters.

Explore our Procurement services →

Speak to an expert at Trace →

Getting Started: The Audit Before the Tender

The most common mistake in FM procurement is going to market before the organisation has done the internal work. Before running a tender, you need to know what you're buying — what assets you have, what services are currently being delivered, what the contract is actually requiring versus what is happening on the ground, and what you want the new arrangement to achieve.

For most organisations, that means a pre-tender audit: a review of the existing contract and performance data, a walkthrough of the asset base, and a clear articulation of the outcomes the new arrangement needs to deliver. It takes four to six weeks and makes every subsequent step faster, cheaper, and more likely to produce the result you need.

If your FM contract is coming up for renewal, if you're questioning whether your incumbent is delivering value, or if you're building a new facility and need to establish FM arrangements from scratch — that pre-tender audit is the right starting point.

The Bottom Line

FM procurement done well is not complicated — but it requires discipline at every stage. A clear contract structure that reflects the organisation's actual needs. A specification built on real asset data. A tender process that creates genuine competition. A contract that incentivises performance. And contract management that holds providers accountable rather than hoping for the best.

The organisations that get the best outcomes from FM are the ones that invest in the procurement process upfront — not the ones that go to market quickly with a loose brief and hope the market does the work for them.

Explore our Procurement services →

Speak to an expert at Trace →

Related reading: Strategy & Network Design · Planning & Operations · Resilience & Risk Management · Property, Hospitality & Services

FM article done — around 2,900 words. Now the defence supply chain security piece.

Title Tag: Supply Chain Security for Australian Defence ContractorsMeta Description: Australian defence contractors face growing supply chain security obligations — DISP, AUKUS readiness, and sovereign capability requirements. Here's what you need to know.Preview Text: AUKUS, the Essential Eight, and growing sovereign capability requirements are raising the bar for every Australian business in the defence supply chain. Here's what it means in practice.

Supply Chain Security in Australian Defence: What Contractors Need to Know

Australia's defence industry is undergoing the most significant structural change in a generation. The AUKUS partnership, the expansion of Australia's sovereign capability ambitions, and a sustained increase in Defence spending are creating substantial opportunities for Australian businesses across the defence supply chain — from Tier 1 primes to specialist SMEs supplying precision-machined components, electronics, logistics services, and professional capabilities.

But the opportunity comes with obligations that many Australian businesses are underprepared for. Supply chain security requirements — covering personnel vetting, physical security, cyber security, and governance — are becoming more stringent, more actively enforced, and a more decisive factor in contract award. Businesses that treat security compliance as a checkbox exercise, rather than a genuine operational capability, will find themselves progressively locked out of the opportunities the defence expansion is creating.

This article explains what Australian defence contractors need to know about supply chain security in 2025 and beyond — what the requirements are, how they apply across different levels of the supply chain, what AUKUS means for qualification standards, and how to build a security posture that is genuinely fit for purpose rather than minimally compliant.

Why Supply Chain Security Has Moved Up the Agenda

Supply chain security in Australian defence is not a new concept, but its prominence has increased dramatically in recent years for several interconnected reasons.

The AUKUS trilateral partnership — established in 2021 between Australia, the United States, and the United Kingdom — requires Australian industry to qualify into US and UK defence supply chains. Those supply chains carry significantly more stringent security requirements than most Australian businesses have previously encountered. Qualifying into a Newport News Shipbuilding supply chain or a UK submarine programme supply chain is not a matter of demonstrating basic security awareness. It requires demonstrable, auditable security capability across multiple domains.

Cyber threats to defence supply chains have intensified globally, with adversaries explicitly targeting less-secure Tier 2 and Tier 3 suppliers as a pathway to compromise Tier 1 primes and ultimately Defence systems. The 2023 Defence Strategic Review identified supply chain resilience and sovereign industrial capability as priority areas, and the Department of Defence has since tightened its approach to contractor security compliance.

The Australian Signals Directorate's Essential Eight cybersecurity framework — previously applied primarily to government agencies — has been extended to defence contractors, with DISP cyber requirements elevated to Essential Eight Maturity Level 2 from October 2024. This is a material uplift for many Australian businesses, particularly SMEs who have historically operated with less formal cybersecurity frameworks.

The Foundation: DISP Membership

The Defence Industry Security Program (DISP) is the primary mechanism through which the Australian Department of Defence manages security across its contractor and supplier base. DISP membership is mandatory for organisations that require access to classified defence information, need to handle or store defence weapons or explosive ordnance, provide security services for Defence bases or facilities, or have a contract that explicitly requires it.

DISP membership is structured across four security domains and four membership levels. The four domains are: governance (security plans, policies, incident management, and organisational accountability), personnel security (background checks, security clearances, and vetting of staff who access classified information), physical security (facility certification and access controls for locations where classified information or assets are held), and ICT and cyber security (protection of digital systems and data from unauthorised access and attack).

The four membership levels align with the Australian Government's security classification system — from entry level (for organisations accessing unclassified but sensitive information) through to Level 3 (for organisations regularly handling TOP SECRET material). Most Australian SMEs entering the defence supply chain will initially require entry-level or Level 1 membership; Tier 1 contractors and those involved in highly classified programmes typically require Level 2 or Level 3.

A critical point for businesses new to DISP: membership is not a one-time compliance event. It requires ongoing maintenance — regular security audits, staff retraining, incident reporting, and continuous alignment with the Defence Security Principles Framework (DSPF). Organisations that achieve DISP membership and then fail to maintain their security posture risk losing membership and, with it, their ability to fulfil existing contracts and bid for new ones.

There is no direct cost associated with DISP membership itself, but the costs of implementing and maintaining the required security measures — facility upgrades, personnel vetting fees, cybersecurity infrastructure, and the ongoing management overhead — can be material for smaller businesses. These costs should be factored into commercial decisions about defence supply chain participation.

The Cyber Uplift Requirement: Essential Eight Maturity Level 2

The most significant recent change to DISP requirements is the elevation of the cyber security domain to full Essential Eight compliance at Maturity Level 2, effective October 2024. For many Australian businesses, this represents a substantial uplift from previous requirements.

The Essential Eight are eight cybersecurity mitigation strategies developed by the Australian Signals Directorate: application control (preventing execution of unapproved software), patching applications and operating systems, configuring Microsoft Office macro settings, user application hardening, restricting administrative privileges, patching operating systems, multi-factor authentication, and regular backups. Maturity Level 2 requires not just that these controls are in place, but that they are applied consistently, tested regularly, and embedded in organisational security culture.

For businesses that were previously compliant with the "Top 4" cyber requirements under the old DISP framework, moving to Essential Eight Level 2 typically requires: implementing application control across all endpoints, strengthening patch management processes to meet defined timeframes, deploying multi-factor authentication across all remote access and privileged accounts, and establishing regular independent testing of backup and recovery capability.

The practical implication for defence SMEs is that cybersecurity can no longer be treated as an IT issue managed by whoever looks after the company's computers. Essential Eight Level 2 compliance requires executive sponsorship, board-level accountability, and a security governance framework that integrates cyber risk into the organisation's broader risk management approach.

AUKUS and the Trilateral Supply Chain: What Australian Suppliers Need to Qualify

AUKUS Pillar 1 — the acquisition of conventionally armed, nuclear-powered submarines — is projected to create around 20,000 jobs in Australia over the next 30 years and create substantial supply chain opportunities for Australian industry. The Australian Government is actively supporting Australian supplier qualification into US and UK submarine supply chains through programmes including the Global Supply Chain (GSC) Program and the Australian Submarine Supplier Qualification (AUSSQ) Pilot Program.

For Australian businesses seeking to participate in AUKUS supply chains, the qualification requirements go beyond DISP membership. The product categories currently being prioritised for Australian industry participation — castings and forgings, precision machining, air and gas flasks, fabricated parts, composites, and electronics — each carry specific technical and quality standards that align with US and UK defence procurement requirements.

Key quality standards relevant to AUKUS supply chain participation include AS9100 (the aerospace and defence quality management standard), ISO 9001:2015, and IPC-A-610 Class 3 for electronic assemblies. These are not merely tick-box certifications — they require demonstrable process capability, traceability systems, and quality management culture that can withstand audit by US or UK prime contractors.

The AUKUS licence-free export framework, operational since September 2024, allows eligible Australian companies to export certain defence goods and technologies to the US and UK without traditional export permits. To be eligible, businesses must be registered with Defence Export Controls (DEC) and obtain an Australian or AUKUS Authorised User Community (AUC) certification via the My Australian Defence Exports (MADE) portal. Eligibility requires that all business be conducted in Australia, the UK, or the US, and excludes technologies on the External Technologies List or classified under the Australian Military Sales Program.

Intellectual Property and Technical Data: The Overlooked Obligation

One of the most consistently underestimated obligations in defence supply chain participation is the management of intellectual property and technical data. Defence contracts routinely involve access to, and creation of, information that is subject to strict controls on how it can be used, shared, stored, and transferred.

The IP provisions in defence contracts are often asymmetric — heavily weighted toward the Commonwealth or the prime contractor — and have long-term commercial implications that SMEs frequently don't fully assess at contract entry. The classification of contractor IP, the treatment of background IP that the supplier brings to the contract, and the rights granted to Defence over deliverables all affect the long-term commercial value of the supplier's own technology investment.

Specialist legal advice on IP and technical data provisions is not optional in defence contracting. It is one of the areas where the cost of inadequate advice at contract entry is highest and most difficult to recover from.

Foreign Ownership, Control, and Influence (FOCI)

The DISP application process includes a Foreign Ownership, Control, and Influence (FOCI) declaration — a requirement to disclose any foreign ownership of the business, foreign board members or senior executives, and any other foreign relationships that could influence the organisation's decisions or create a security risk.

FOCI considerations have become more prominent in Australian defence industry policy in recent years, reflecting broader concerns about supply chain security and the protection of sensitive technology. Businesses with foreign ownership or governance structures need to understand how FOCI declarations affect their DISP eligibility and what mitigation arrangements may be required.

This is particularly relevant for Australian subsidiaries of foreign-owned parent companies, joint ventures with international partners, and businesses that have taken foreign investment. Early engagement with the DISP team and specialist legal advice on FOCI implications is strongly recommended before investing in the capability uplift required for DISP membership.

Building a Genuine Security Posture

The businesses that will capture the greatest share of AUKUS and broader defence supply chain opportunity are not those that achieve minimum DISP compliance and stop — they are those that build genuine security capability that becomes a competitive differentiator.

A genuine security posture means: a Chief Security Officer with real authority and executive accountability, not just a title; a security governance framework that is integrated with the organisation's operations, not bolted onto it; a cyber security investment that goes beyond Essential Eight compliance to address the specific threat profile of a defence contractor; a personnel security culture where every employee understands their obligations and takes them seriously; and a continuous improvement mindset that treats security as an evolving capability, not a static compliance state.

For defence SMEs, building this posture requires investment — in people, in systems, and in the time required to embed security thinking into how the business operates. That investment should be treated as a strategic capability decision, not a compliance cost. The businesses that make it early will have a material advantage over those that make it under the pressure of a specific contract requirement.

How Trace Consultants Can Help

At Trace Consultants, we help Australian defence contractors navigate the supply chain security requirements of the current defence environment — from DISP readiness through to AUKUS supply chain qualification and procurement strategy.

Defence procurement strategy. We help defence contractors understand the opportunity landscape — what programmes are active, what supply chain positions are available, and what capability and compliance investments are required to be competitive. We support the development of a BD and capability investment strategy aligned to realistic near-term opportunities.

Procurement operating model and supply chain design. For organisations building or scaling their defence supply chain capability, we design the procurement and supply chain operating model — supplier qualification frameworks, subcontractor management processes, and the internal governance structures that meet Defence's expectations.

Resilience and risk management. We help defence contractors assess and strengthen the resilience of their own supply chains — identifying single-source dependencies, mapping exposure to geopolitical and supply disruption risk, and designing the mitigation strategies that protect programme delivery commitments.

Organisational design and workforce planning. Building a credible defence supply chain capability requires the right people in the right roles. We support the organisational design and workforce planning decisions that underpin a sustainable defence industry participation strategy — from security-cleared personnel pipelines to the trade and technical skills required for AUKUS-related manufacturing.

Government and Defence sector expertise. Our work across government and defence gives us a practical understanding of how Defence procurement works, what primes are looking for in their supply chains, and what the realistic pathway to supply chain participation looks like for businesses at different stages of maturity.

Explore our Government & Defence sector work →

Speak to an expert at Trace →

Getting Started: The Gap Assessment

For most Australian businesses entering or scaling their defence supply chain participation, the most useful first step is an honest gap assessment — a clear picture of where the business currently sits against DISP requirements, AUKUS qualification standards, and the specific requirements of the contracts or programmes they are targeting.

That assessment typically takes two to four weeks and produces a prioritised roadmap of the capability and compliance investments required. It identifies the quick wins — things that can be addressed in weeks — and the longer-lead investments — facility upgrades, quality system implementation, personnel security clearances — that need to start immediately to be available when they are needed.

The AUKUS programme will create genuinely significant opportunities for Australian industry over the next decade. The businesses that are ready when those opportunities crystallise will be the ones who started building their capability well before the contract was advertised.

The Bottom Line

Supply chain security in Australian defence is no longer a bureaucratic hurdle to be minimised. It is an increasingly demanding set of obligations that reflect the genuine risk environment facing Australian defence programmes — and a genuine competitive differentiator for businesses that take it seriously.

DISP membership, Essential Eight cyber compliance, AUKUS qualification standards, and FOCI obligations are all manageable. They require investment, planning, and sustained commitment — but none of them are beyond the reach of a capable Australian SME that starts the work early and approaches it strategically.

The opportunity created by AUKUS and Australia's sovereign capability agenda is real. So is the bar for participation.

Explore our Government & Defence sector work →

Speak to an expert at Trace →

Procurement

Facilities Management Procurement: How to Structure and Tender FM Contracts

Most Australian organisations significantly overpay for facilities management — not because the market is uncompetitive, but because the procurement process is poorly structured. Here's how to fix it.

Facilities Management Procurement: How to Structure and Tender FM Contracts in Australia

Facilities management is one of the largest and most consistently mismanaged spend categories in Australian organisations. For a hospital, an integrated resort, a government agency, or a large commercial property portfolio, FM spend — covering mechanical and electrical maintenance, cleaning, security, waste management, catering, and building services — can easily reach tens of millions of dollars annually. It sits in almost every organisation's top five spend categories. It receives a fraction of the procurement rigour applied to direct materials or major capital works.

The result is predictable. Contracts that were competitive at award drift over time as providers build margin into variations, embed cost escalation mechanisms that exceed CPI, and reduce service delivery quality once the relationship is established and switching costs are high. Specifications that were written for a building that no longer exists. KPIs that measure activity rather than outcomes. Contract management that is reactive rather than proactive. And a renewal process that defaults to incumbent re-appointment because running a proper market process feels too hard.

This article explains how to run FM procurement properly — how to structure the contract model, specify requirements in a way that drives competitive tension and performance, run a rigorous tender process, and manage the resulting contracts to capture the value the process was designed to deliver.

What FM Procurement Actually Covers

Facilities management procurement encompasses two broad categories of service, and understanding the distinction matters for how you structure contracts and go to market.

Hard FM covers the maintenance and management of physical building systems and infrastructure: mechanical, electrical, plumbing, and fire (MEP/F) maintenance; HVAC; lifts and escalators; building management systems (BMS); and statutory compliance testing. Hard FM work is typically asset-intensive, requires licensed tradespeople, and has a significant planned preventative maintenance (PPM) component alongside reactive and corrective work.

Soft FM covers services that support building occupants rather than building systems: cleaning, security, waste management, catering, landscaping, pest control, and reception or concierge services. Soft FM is typically labour-intensive, has lower technical barriers to entry, and is a more competitive market than hard FM in most Australian locations.

The strategic question at the start of any FM procurement process is how to bundle or separate these services — whether to go to market for an integrated facilities management (IFM) arrangement with a single provider managing the full scope, or to run separate procurement exercises for hard FM, soft FM, and potentially individual service lines within those categories.

Bundled vs. Unbundled: Getting the Contract Structure Right

The bundling decision is the single most consequential structural choice in FM procurement, and there is no universally correct answer. The right structure depends on the complexity of the portfolio, the organisation's contract management capability, and the depth of the market for the services in question.

Integrated FM (single provider) reduces contract management overhead and creates clear accountability — one provider owns the outcome, not individual services. It suits organisations with limited internal FM expertise, geographically dispersed portfolios, or a strategic preference for a single relationship. The trade-off is market risk: the pool of credible IFM providers in Australia is relatively shallow, bundling typically reduces competitive tension on individual service lines, and IFM providers routinely subcontract soft FM services, adding a margin layer that direct procurement would eliminate.

Bundled hard FM / separate soft FM is the most common structure for mid-to-large Australian organisations. It concentrates the technically complex work — MEP maintenance, statutory compliance, BMS — with a specialist hard FM provider, while running separate (and often more competitive) procurement for cleaning, security, and waste. This structure provides better market access for each service category while keeping the number of contracts manageable.

Fully unbundled — separate contracts for each service line — maximises competitive tension and eliminates subcontractor margin, but creates significant contract management complexity. It suits organisations with mature FM procurement functions, large portfolios with genuine scale in each service category, and the internal bandwidth to manage multiple provider relationships.

A fourth option, increasingly used by large property owners and operators, is the managing agent model — where a specialist FM consultant or managing agent is appointed to manage the supply chain on behalf of the owner, with service providers contracted directly. This model is particularly relevant for organisations that want the accountability of integrated FM without committing to a single IFM provider.

Specifying Requirements: Output vs. Outcome

The most common failure in FM tender documentation is over-specifying inputs and under-specifying outcomes. A specification that prescribes exactly how many cleaners should be on site, what hours they work, and what tasks they perform on each day of the week is a task-based specification. It tells providers how to deliver the service, not what the service needs to achieve — and it eliminates the provider's ability to innovate, substitute technology for labour, or optimise their delivery model to reduce cost.

Outcome-based specifications define what the end state should be — "the facility will be maintained at Condition Grade B or better across all asset categories" or "all statutory compliance testing will be completed within scheduled intervals with zero overdue items" — and leave the method to the provider. This approach drives genuine competition on delivery model and commercial efficiency, not just on headcount rates.

In practice, the best FM specifications blend both approaches. Critical compliance and safety obligations — statutory inspection frequencies, licensing requirements, response time requirements for emergency reactive work — are specified as mandatory process requirements. Service quality outcomes — cleanliness standards, asset condition targets, occupant satisfaction metrics — are specified as measurable outputs. How the provider achieves those outputs is their problem to solve.

Asset data is the foundation of a good specification. A specification for hard FM maintenance is only as credible as the asset register underpinning it. If the organisation doesn't know what assets it has, where they are, what their condition is, and when they were last serviced, providers will price in risk — and they should. A pre-tender asset audit, even a rapid one, almost always pays for itself in reduced risk contingency pricing.

Pricing Models: Getting Commercial Incentives Right

FM contracts can be priced in multiple ways, and the pricing model determines where the commercial risk sits and what behaviour it incentivises.

Lump sum / fixed price provides cost certainty but requires a very well-specified scope. Any gap in the specification becomes a variation. Providers who price lump sum on a poorly specified scope will either win at an artificially low price and then recover through variations, or price at a premium that reflects the uncertainty. Lump sum pricing works best for soft FM services where the scope is relatively predictable.

Schedule of rates prices individual units of work — labour hours by trade and grade, materials at cost plus margin, reactive callout fees — and the total contract value depends on actual consumption. This model provides flexibility and transparency but transfers volume risk to the client. Schedule of rates is appropriate for reactive maintenance where work scope is inherently variable.

Hybrid pricing — lump sum for planned preventative maintenance, schedule of rates for reactive and project work — is the most common model for hard FM and typically provides the best balance of cost certainty and flexibility.

Gainshare / performance-linked pricing ties a component of provider remuneration to measurable performance outcomes. This model is more sophisticated to design and administer but aligns provider incentives with client outcomes in a way that fixed-price models don't. It is increasingly used in large, long-term FM contracts where the organisation wants to create a genuine commercial incentive for performance improvement over time.

Running the Tender Process

A well-run FM tender process follows a structured sequence that most Australian organisations compress or skip entirely.

Market engagement before the RFP. Before issuing formal tender documents, engage the market. Run an Expression of Interest or industry briefing to test the appetite of credible providers, understand market capacity constraints, and gather input on specification approach. Providers who have contributed to the specification design are more likely to submit competitive, well-reasoned bids. Market engagement also signals to the provider community that this is a serious procurement — which affects the quality of resources providers allocate to bidding.

RFP documentation that is complete and coherent. The single biggest determinant of bid quality is the quality of the tender documentation. Incomplete asset data, ambiguous scope, inconsistent pricing schedules, and unrealistic mobilisation timelines all reduce the quality of bids and increase the risk premium providers embed in their pricing. The RFP should include: a complete scope of services, the asset register, historical spend and volume data, the pricing schedule, the draft contract, the evaluation criteria and weightings, and a realistic timeline.

Site visits as a mandatory tender step. For hard FM and IFM tenders, require all shortlisted providers to conduct a site visit before submitting their bid. A provider who has walked the assets, understood the building systems, and assessed the condition of the portfolio will price more accurately than one working from documents alone. Accurate pricing reduces variation risk after contract award.

Evaluation that weights more than price. FM contracts are long-term service relationships. A provider who wins on price and underdelivers on service quality is not a good procurement outcome — and the cost of re-tendering within 12 months is significant. The evaluation scorecard should weight technical capability, delivery model, mobilisation plan, subcontractor management, and reference checks alongside commercial pricing. For hard FM in particular, the licensing, compliance, and safety credentials of the bidding entity should be a gate criterion before the commercial evaluation begins.

Reference checks with comparable clients. Always check references — and do it properly. A phone conversation with a peer organisation running a similar portfolio is worth more than any written reference. Ask specifically about variation rates, response time performance, staff turnover, and how the provider manages relationship issues. These are the things that determine what it is like to actually work with a provider, as distinct from what they put in a tender submission.

Contract Management: Where FM Value Is Won or Lost

A well-run tender process that produces a well-structured contract is only half the work. The other half is contract management — and it is where most Australian organisations leave the most value on the table.

FM contract management requires three things: performance measurement against the KPIs specified in the contract, a governance cadence that creates structured visibility and accountability, and a commercial discipline around variations and cost escalation.

KPIs need to be measurable and measured. KPIs that exist in the contract but are never tracked are not KPIs — they are aspirations. The KPI framework should be built around data the provider is required to report, on a defined schedule, in a defined format. Organisations that rely on providers to self-report without independent verification will consistently receive optimistic data.

Planned preventative maintenance compliance is the leading indicator. For hard FM, PPM compliance — the percentage of scheduled maintenance tasks completed on time and to specification — is the most important leading indicator of asset condition and statutory compliance risk. An FM provider who is consistently behind on PPM is creating deferred maintenance liability that will crystallise as emergency reactive work, equipment failure, or compliance breach. Monitor it monthly. Act on it early.

Manage variations actively. In a poorly managed FM contract, variations become a profit recovery mechanism for providers who priced aggressively to win the work. Every variation request should be assessed against the specification to determine whether it genuinely falls outside scope. Variations that are in scope should be rejected. Variations that are legitimate should be priced against the schedule of rates in the contract, not negotiated from scratch.

Benchmark before renewal. Before re-tendering or renewing an FM contract, benchmark the incumbent's pricing and performance against current market rates. FM markets move. The rates that were competitive four years ago may not be competitive today — in either direction. An independent benchmarking exercise, conducted 12–18 months before contract expiry, gives the organisation the evidence base to negotiate effectively or to run a genuinely competitive tender.

How Trace Consultants Can Help

At Trace Consultants, we help Australian organisations structure, tender, and manage FM contracts that deliver genuine value — not just at award, but over the life of the relationship.

FM procurement strategy and contract structure. We advise on the optimal bundling strategy for your portfolio — whether IFM, bundled hard/soft FM, or fully unbundled — based on your portfolio complexity, internal capability, and market context. We design the pricing model, KPI framework, and contract structure before the tender process begins.

Procurement process management. We design and run the end-to-end tender process — specification development, RFP documentation, market engagement, site visit coordination, bid evaluation, and contract negotiation. We manage the process so your team doesn't have to, while ensuring you maintain commercial control of the outcome.

Specification development and asset data. For hard FM tenders, we support the asset data preparation that underpins a credible specification — rapid asset condition assessments, PPM schedule development, and statutory compliance gap analysis. We ensure providers are pricing against accurate data, not protecting themselves against uncertainty.

Benchmarking and incumbent review. We benchmark FM contracts against current market rates and performance data, providing the evidence base for renewal negotiations or the decision to re-tender. For organisations questioning whether their current FM arrangements are delivering value, a benchmarking exercise is typically the right starting point.

Contract management frameworks. We design the governance, reporting, and performance management frameworks that make FM contracts deliver what they promised — including KPI dashboards, variation management protocols, and escalation mechanisms.

We work across property, hospitality, and integrated resorts, health and aged care, government and defence, and retail. The FM procurement challenge is consistent across sectors. The scale, complexity, and regulatory context differ — and that's where sector experience matters.

Explore our Procurement services →

Speak to an expert at Trace →

Getting Started: The Audit Before the Tender

The most common mistake in FM procurement is going to market before the organisation has done the internal work. Before running a tender, you need to know what you're buying — what assets you have, what services are currently being delivered, what the contract is actually requiring versus what is happening on the ground, and what you want the new arrangement to achieve.

For most organisations, that means a pre-tender audit: a review of the existing contract and performance data, a walkthrough of the asset base, and a clear articulation of the outcomes the new arrangement needs to deliver. It takes four to six weeks and makes every subsequent step faster, cheaper, and more likely to produce the result you need.

If your FM contract is coming up for renewal, if you're questioning whether your incumbent is delivering value, or if you're building a new facility and need to establish FM arrangements from scratch — that pre-tender audit is the right starting point.

The Bottom Line

FM procurement done well is not complicated — but it requires discipline at every stage. A clear contract structure that reflects the organisation's actual needs. A specification built on real asset data. A tender process that creates genuine competition. A contract that incentivises performance. And contract management that holds providers accountable rather than hoping for the best.

The organisations that get the best outcomes from FM are the ones that invest in the procurement process upfront — not the ones that go to market quickly with a loose brief and hope the market does the work for them.

Explore our Procurement services →

Speak to an expert at Trace →

Strategy & Network Design

Make vs Buy: Insource vs Outsource Australia

Most Australian businesses make insource vs outsource decisions reactively — under cost pressure, after a contract expires, or when something breaks. Here's how to make them deliberately.

Make vs Buy: How Australian Businesses Should Decide What to Insource and What to Outsource

Most Australian businesses make insource versus outsource decisions reactively. A 3PL contract comes up for renewal and someone asks whether they should bring warehousing back in-house. A manufacturing cost blows out and leadership floats offshoring production. A service delivery problem surfaces and the instinct is to outsource it away. A new COO arrives with a view that the previous leadership outsourced too much — or not enough.

What's missing in almost every case is a structured framework for making the decision. Not a gut feel about control, not a cost comparison that only captures the visible numbers, and not a benchmarking exercise that tells you what other businesses do without telling you whether it's right for yours. A deliberate, repeatable analytical process that answers a clear question: for this specific activity, at this point in time, does make or buy produce the better outcome for our business?

This article sets out that framework. It applies to manufacturing and production decisions, to logistics and distribution, to procurement and service delivery, and to the workforce planning dimension that most make vs buy analyses get wrong. It is written for Australian operations and supply chain leaders who are making real decisions — not consulting to a theoretical case.

What Make vs Buy Actually Means

Make vs buy — also called insource vs outsource — is the decision about whether to perform an activity using your own people, assets, and processes, or to contract it to an external party.

The question is deceptively simple. The answer rarely is. Because the right answer depends on a combination of factors — cost, capability, strategic importance, risk, flexibility, and market maturity — that interact in ways that a simple cost comparison doesn't capture. And because the decision isn't made once: it needs to be revisited as your business changes, as the market for external providers matures or deteriorates, and as your strategic priorities shift.

In supply chain and operations, make vs buy decisions arise constantly. Should we operate our own fleet or use a carrier? Should we run our own warehouse or use a 3PL? Should we manufacture this component or buy it from a supplier? Should we manage our own procurement function or engage a managed service? Should we run our own maintenance team or outsource facilities management? Each of these is a make vs buy decision. Each deserves structured analysis rather than habit or instinct.

The Four Dimensions of the Decision

A rigorous make vs buy analysis evaluates four dimensions. Cost is the one everyone starts with. The other three are the ones that most often determine whether the decision is the right one.

1. Total Cost — Not Just the Visible Numbers

The most common error in make vs buy analysis is comparing the wrong costs. Businesses compare the external provider's quote against the internal cost of production — and the internal cost is almost always underestimated.

A genuine total cost comparison for the make option includes: direct labour (including on-costs, leave loading, superannuation), management overhead attributable to the activity, facilities cost (lease, utilities, maintenance), equipment and asset depreciation, technology and systems costs, quality and rework costs, and the opportunity cost of capital tied up in assets. Many organisations include the first two and miss the rest. The resulting comparison flatters the insource option.

The buy option has its own hidden costs: transition costs (one-time, but real), contract management overhead, the cost of service failures that the contract doesn't fully compensate, and the price escalation that typically occurs once you're locked into a relationship and switching is expensive. A provider who prices competitively to win the work may look quite different at renewal.

Total cost comparison also needs to account for volume and volatility. A fixed-cost insource model looks cheap at high volume and expensive at low volume. A variable-cost outsource model looks expensive at high volume and attractive when throughput drops. Australian businesses with significant demand seasonality — retail, hospitality, agricultural processing — need to model cost across their actual volume range, not just at average throughput.

2. Strategic Importance and Core Capability

The second dimension is whether the activity is core — whether it contributes to your competitive differentiation, embeds proprietary knowledge or intellectual property, or defines the experience your customers have with your brand.

Activities that are strategically core should generally be insourced. Not because outsourcing them is always more expensive, but because control over them is itself valuable. A food manufacturer whose product quality depends on a specific production process has a strategic reason to keep that process in-house, even if a contract manufacturer could produce the same output at lower unit cost. A retailer whose customer experience is defined by last-mile delivery has a strategic reason to think carefully before handing that entirely to a carrier whose brand accountability to your customers is limited.

Activities that are not strategically core — that are important operationally but don't differentiate you in the market — are candidates for outsourcing. Transactional procurement, standard warehousing for commodity products, routine fleet management, basic facilities maintenance: these are areas where a specialist provider will typically deliver better performance at lower cost than an in-house team for whom these activities are peripheral.

The test is not whether an activity is important. Almost everything is important. The test is whether doing it better than your competitors, or doing it differently, creates value that customers recognise and pay for.

3. Market Maturity — Is There a Provider Who Can Actually Do It?

The third dimension is often overlooked entirely: whether there is an external market that can credibly deliver the activity at the required standard.

In Australia, the market for external providers varies enormously by activity and geography. 3PL capability in Melbourne and Sydney is mature, competitive, and capable of servicing complex accounts. 3PL capability in Darwin or regional Western Australia is thinner, more expensive, and carries greater transition risk. Cold chain logistics is more constrained than ambient. Specialist manufacturing capability for certain product categories is limited domestically.

Before deciding to outsource, you need to know whether a credible market exists — and whether the providers in that market have the capability, capacity, and financial stability to be a reliable long-term partner. A make vs buy decision that concludes "buy" when the market can't actually deliver is not a useful outcome. It produces a poor outsourced arrangement that the organisation then spends years trying to exit.

Market maturity also affects the leverage you have. In a competitive market with multiple capable providers, you can drive hard commercial terms and hold providers accountable through genuine re-tendering. In a thin market with one or two credible options, your leverage is limited and your exposure to provider failure is higher.

4. Risk — What Happens When It Goes Wrong

The fourth dimension is risk: what is your exposure if the activity is performed badly, and how does that exposure differ between insource and outsource?

For activities where failure has severe consequences — production stoppages, customer delivery failures, regulatory non-compliance, safety incidents — the make vs buy decision needs to explicitly account for risk. Outsourcing transfers operational execution but it does not transfer accountability for outcomes. If a contract manufacturer produces defective product, the reputational and regulatory consequences land with you. If a 3PL mismanages your inventory, your customers experience the failure.

The risk question cuts both ways. For some activities, insourcing concentrates risk — a single internal team failure can cascade through the whole operation. For others, outsourcing to a single provider creates dangerous dependency — and the right answer is either to insource for control or to use multiple providers to maintain resilience.

Supply chain resilience analysis is increasingly integrated into make vs buy decisions for this reason. The question isn't just which option costs less under normal operating conditions. It's which option holds up when conditions aren't normal — and in the current Australian operating environment, that's not a hypothetical.

The Hybrid Model: Neither Fully In nor Fully Out

One of the most important developments in Australian operations practice over the last decade is the normalisation of hybrid models. The binary choice — fully insource or fully outsource — is increasingly a false one.

Hybrid models take many forms. A business might own and manage its distribution centre but use a 3PL workforce to run the operation — capturing the asset ownership and process control benefits of insourcing with the labour flexibility and specialist capability of outsourcing. A manufacturer might insource final assembly and quality control while outsourcing component production. A procurement function might manage strategic category strategy and supplier relationships in-house while outsourcing transactional purchasing to a managed service.

The logic of a hybrid model is that different elements of an activity have different strategic importance and risk profiles. Disaggregating the activity and applying the make vs buy framework to each element independently often produces a more nuanced and commercially optimal answer than applying it to the whole.

The challenge of hybrid models is governance and accountability. When responsibility is split between internal and external parties, the interfaces between them become critical. Clear contractual and operational boundaries, well-defined KPIs, and strong contract management capability on the internal side are prerequisites for hybrid models to work.

When to Revisit the Decision

Make vs buy is not a one-time decision. It needs to be revisited when circumstances change materially — and in Australian operations, circumstances change frequently.

Triggers for revisiting an existing insource or outsource arrangement include: significant volume growth or decline that changes the cost economics; a contract renewal that provides a natural market test; a deterioration in provider performance that raises the question of whether the capability exists in-house or elsewhere; a strategic shift that changes what is and isn't core to the business; or a market development — new providers entering, existing providers exiting — that changes the competitive landscape.

The mistake many Australian businesses make is treating the current arrangement as the default and requiring a high burden of proof to change it. In practice, both directions of change — insourcing an outsourced activity, or outsourcing an insourced one — are legitimate strategic moves that should be evaluated on their merits when circumstances warrant, not defended on the basis of inertia.

Common Mistakes in Australian Make vs Buy Decisions

A few patterns consistently produce poor outcomes.

Deciding on cost alone. Unit cost comparisons that ignore strategic importance, risk, and transition costs produce decisions that look right in the spreadsheet and wrong in practice. The businesses that have brought back in-house activities that were outsourced cheaply — only to find that the capability had atrophied and the market option was now the only viable one — understand this lesson the hard way.

Outsourcing a broken process. Outsourcing does not fix underlying process problems — it transfers them, usually at a premium. A warehousing operation with poor inventory accuracy will not improve simply because a 3PL takes it over. The process needs to be understood and stabilised before the outsource decision is made, otherwise the transition embeds the dysfunction into a contract that is expensive to exit.

Underestimating transition costs and risks. The one-time cost of transitioning an activity — either direction — is systematically underestimated in make vs buy analysis. Transition involves knowledge transfer, system integration, parallel running periods, staff redeployment or redundancy, and a period of elevated management overhead. These costs need to be included in the financial model, amortised over the planning horizon, to get an accurate picture of when the new arrangement becomes economic.

Ignoring the workforce dimension. Make vs buy decisions in operations almost always have a workforce planning dimension that gets handled separately — if at all. Insourcing requires hiring or redeploying people with the right skills. Outsourcing may require redundancy or redeployment of existing staff. The workforce implications affect both the cost and the feasibility of the decision, and they need to be integrated into the analysis rather than treated as an afterthought.

Not defining what success looks like before you decide. A make vs buy decision should specify, upfront, the performance outcomes the chosen model needs to deliver — service levels, cost targets, quality standards — and how those will be measured. Decisions made without this definition produce arrangements that drift, because there's no agreed baseline against which performance can be evaluated.

How Trace Consultants Can Help

At Trace Consultants, we help Australian businesses make rigorous insource versus outsource decisions — and then implement whichever path produces the better outcome.

Make vs buy analysis and decision support. We build the full analytical framework: total cost modelling across both options, strategic importance assessment, market scan for external capability, risk evaluation, and workforce implications. We produce a recommendation the CFO and COO can defend to the board — not a balanced presentation that leaves the decision unmade.

Procurement operating model design. For businesses evaluating their procurement function specifically — whether to build internal category management capability, use a managed service, or operate a hybrid — we design the operating model that fits the scale, complexity, and strategic priorities of the organisation.

Warehousing and distribution market assessment. For businesses evaluating whether to insource or outsource logistics, we provide an independent view of the external market — what providers can actually deliver, at what cost, and under what contractual terms — to ensure the buy option is being compared accurately.

Workforce planning integration. We integrate the workforce implications into the make vs buy analysis — modelling the headcount, capability, and cost implications of both options, and designing the transition approach for whichever direction is chosen.

Implementation and transition management. We manage the transition — in either direction — to ensure it is executed without service disruption and delivers the financial outcomes the decision was based on.

We work across retail and FMCG, manufacturing, health and aged care, government and defence, and hospitality. The framework is consistent. The right answer for each client is not.

Explore our Strategy & Network Design services →

Speak to an expert at Trace →

Getting Started: The Question Before the Question

Before running a make vs buy analysis, the most useful thing is to get clarity on what is actually driving the question. Is it a cost problem? A performance problem? A strategic realignment? A contract renewal that has forced the issue?

The answer shapes the analysis. A cost-driven review needs a rigorous total cost model. A performance-driven review needs to first determine whether the performance problem is inherent to the current model or fixable within it — because outsourcing a performance problem you don't fully understand is one of the most reliable ways to make it worse. A strategic realignment needs to start with a clear articulation of what is and isn't core before any financial modelling begins.

If you're facing an insource versus outsource decision — for logistics, manufacturing, procurement, or service delivery — and you want to make it well, that's the right starting point for a conversation.

The Bottom Line

Make vs buy is one of the most consequential decisions in operations. Done well, it produces arrangements that are cost-effective, resilient, and aligned with the strategic direction of the business. Done poorly — on the basis of cost alone, without proper transition planning, or without revisiting assumptions as circumstances change — it produces exactly the kind of lock-in and underperformance that keeps operations leaders awake at night.

The framework isn't complicated. The discipline to apply it rigorously, every time, is.

Explore our Planning & Operations services →

Speak to an expert at Trace →

Warehousing & Distribution

How to Select a 3PL in Australia

March 2026
Most Australian businesses approach a 3PL selection the wrong way — starting with provider shortlists before they've defined what they actually need. Here's how to do it properly.

How to Select a 3PL in Australia: A Practical Guide for Operations and Supply Chain Leaders

Choosing a third-party logistics provider is one of the most consequential operational decisions an Australian business can make. Get it right and you gain a scalable, cost-efficient distribution capability with a partner who grows with you. Get it wrong and you're locked into a contract that underdelivers on service, erodes customer relationships, and costs more to exit than it would have cost to do it properly the first time.

Most businesses approach 3PL selection the wrong way. They start with a shortlist of providers — often compiled from industry contacts or a quick search — and run a loose tender before picking whoever came in cheapest or made the best impression in the room. What gets skipped is the foundational work: defining what you actually need, specifying it clearly enough that providers can price it accurately, and building a scorecard that evaluates the things that will matter in year two and three, not just at contract signing.

This guide covers how to run a rigorous 3PL selection process in Australia — from the requirements definition phase through to transition and go-live. It applies to businesses outsourcing logistics for the first time, and equally to those retendering an existing arrangement where performance has drifted.

What Is a 3PL and What Does It Actually Do?

A third-party logistics provider manages some or all of the warehousing, inventory management, and distribution functions for a business. In the Australian market, 3PL services typically span: inbound receiving and put-away, bulk and pick-face storage, order picking and packing, outbound despatch and carrier management, returns processing, and inventory reporting.

Beyond that baseline, 3PLs vary considerably in capability. Some offer value-added services — kitting, labelling, quality inspection, cold chain management, dangerous goods handling. Some have sophisticated warehouse management systems (WMS) with real-time visibility and customer portal access. Others are running basic operations that look more impressive in a sales presentation than they do on the warehouse floor.

The distinction that matters most is between providers who are genuinely integrated logistics partners — capable of contributing to your supply chain strategy, managing complexity, and scaling with your business — and providers who are fundamentally space-and-labour businesses offering a commodity service. Both have their place. Knowing which one you need before you go to market is the starting point for a good selection process.

Before You Go to Market: Define Your Requirements

The single most important step in a 3PL selection is the one most businesses skip or undercook: a rigorous definition of current-state requirements and future-state needs before any provider engagement begins.

Volume and throughput profile. How many pallets in and out per week? How many order lines per day? What is your peak-to-average ratio — do you run at three times average volume in the lead-up to Christmas, or is throughput relatively consistent? A 3PL that can handle your average volume may fall over at peak. Understanding and communicating your profile accurately — not optimistically — is essential for getting accurate pricing and capacity commitments.

SKU profile and product characteristics. How many active SKUs do you carry? What are the storage requirements — ambient, temperature-controlled, hazardous, high-value? What does your pick profile look like — high-volume single-SKU orders, or complex multi-line orders with value-added processing? The physical characteristics of your product (dimensions, weight, fragility, shelf life) determine what infrastructure and capability a 3PL needs to service you.

Service level requirements. What do your customers require in terms of order cut-off times, despatch frequency, and delivery windows? Do you ship direct-to-consumer, direct-to-trade, or both? Are there specific carrier requirements from your major customers — some large retailers mandate specific carriers or booking systems? These requirements need to be documented and included in your tender specifications, not discovered after contract signature.

Integration requirements. How does your current order management or ERP system connect to a 3PL's WMS? What data do you need — real-time inventory visibility, despatch confirmations, DIFOT reporting? Integration failure is one of the most common causes of 3PL transition pain. Understanding your technical requirements upfront, and validating that prospective providers can meet them, is non-negotiable.

Growth trajectory. Where will your volume be in two and four years? A 3PL selection should be made for your future business, not your current one. A provider with capacity and capability headroom to grow with you is worth paying a modest premium over one who is the right fit today but will be under pressure in eighteen months.

The Australian Market: What You're Choosing Between

The Australian 3PL market is fragmented. At one end are the large national operators — Linfox, Toll, DHL Supply Chain, Yusen Logistics, CEVA — with multi-site networks, significant technology investment, and the infrastructure to service large, complex accounts across multiple states. At the other end are specialist regional operators who may offer better service levels and more responsive account management for a mid-market business that would be a low priority for a national provider.

Between those extremes is a broad middle market of operators with one or two facilities, varying degrees of technology maturity, and service offerings ranging from basic bulk storage through to sophisticated fulfilment operations. The right choice depends on your requirements — geography, volume, complexity, service level expectations — not on provider size or brand recognition.

A few characteristics of the Australian market worth noting for the selection process. Australia's geography creates genuine logistics complexity — a national distribution network covering Melbourne, Sydney, Brisbane, Perth, and Adelaide requires either a provider with multi-state infrastructure or a deliberate strategy for how secondary markets are served. For businesses whose customers are concentrated in south-east Queensland and the eastern seaboard, a single-site operator may be entirely adequate. For businesses with significant Western Australian volume, the freight cost and lead time implications of eastern-seaboard-only storage are material and need to be worked through explicitly.

Temperature-controlled capability is a genuine differentiator in the Australian market. Cold chain 3PL capacity — particularly for the 2–8°C range — is constrained relative to ambient, and the providers with genuine capability in this space are a smaller subset of the overall market.

Running the Selection Process

A rigorous 3PL selection process runs in four stages.

Stage 1: Requirements definition and longlist development. Build the requirements document — volume profile, SKU profile, service level requirements, integration requirements, growth trajectory. Identify a longlist of eight to twelve providers with plausible capability to meet your needs. The longlist should include both large nationals and credible specialist operators. Don't pre-filter too aggressively at this stage — surprises in both directions are common.

Stage 2: RFI (Request for Information). Issue a structured RFI to the longlist. The purpose is to gather enough information to shortlist to four or five providers for a full tender. Key questions: geographic footprint and capacity, WMS capability and integration track record, relevant customer references (same sector, similar complexity), financial stability, and any specialist capabilities required. Conduct reference checks at this stage — not after you've already chosen a preferred provider.

Stage 3: RFP (Request for Proposal) and site visits. Issue a detailed RFP to your shortlist. The RFP should include your full requirements specification, a standard pricing schedule, and specific questions about how the provider would handle your account. Require providers to submit pricing against your actual volume profile, not a simplified version of it. Visit every shortlisted site before scoring — a warehouse tour tells you more about an operator's culture, systems discipline, and housekeeping standards than any document they produce.

Stage 4: Evaluation, negotiation, and selection. Score proposals against a weighted scorecard that reflects your actual priorities. Price matters, but it is rarely the only thing that matters — and it is often the least reliable indicator of total cost. A provider with higher headline rates and better inventory accuracy, DIFOT performance, and damage rates will typically deliver better total cost than the cheapest quote. Negotiate with your preferred two providers before making a final selection.

What to Put in the Contract

The 3PL contract is where a significant number of Australian businesses underinvest — and where they pay for it later. Key elements that should be explicitly addressed.

Service level agreements with teeth. Define the KPIs — DIFOT, inventory accuracy, order accuracy, inbound turnaround time — with specific targets and specific consequences for missing them. A contract that references service levels but doesn't specify what happens when they're breached is not a contract for performance, it's a contract for goodwill.

Pricing structure and variation mechanisms. Understand exactly how you will be charged — per pallet in, per pallet stored per week, per order line, per carton despatched, per labour hour for value-added services — and how charges vary with volume. Know what happens at peak. Know what the annual CPI or labour cost escalation mechanism is. Pricing surprises are the most common source of 3PL relationship breakdown in the first twelve months.

Technology and reporting obligations. What data will the 3PL provide, in what format, and at what frequency? What portal or API access will you have? What are the response time obligations for data queries or discrepancy investigations? Specify these as contract obligations, not as assumptions.

Exit provisions. How long is the initial term? What are the notice periods? What happens to stock and data on exit — transition assistance obligations, data extraction, final reconciliation? The time to negotiate your exit from a 3PL relationship is before you've entered it, not when things have gone wrong and you're trying to leave.

The Transition: Where 3PL Selections Most Often Fail

Selecting the right provider and then transitioning badly is a more common failure than selecting the wrong provider. 3PL transitions are high-risk operational events — there is a period where stock is moving between sites, system integrations are being tested, and a new team is learning your product, processes, and requirements. Service disruption during this period is almost inevitable unless the transition is planned and managed rigorously.

Key principles for a successful transition: run parallel operations for as long as possible before the cutover; never cut over at peak; test system integration end-to-end before a single live order goes through it; train the 3PL team on your product before go-live, not during; and assign a dedicated transition manager on your side whose job it is to manage nothing else during the cutover period.

The majority of 3PL transition failures are not caused by the provider being incapable — they're caused by insufficient planning, unrealistic timelines, and underestimating the complexity of integrating two organisations' systems, processes, and people.

How Trace Consultants Can Help

At Trace Consultants, we help Australian businesses run rigorous 3PL selection processes — from requirements definition through to contract execution and transition management.

Requirements definition and market assessment. We build the requirements specification that is the foundation of a good selection process — volume and SKU profiling, service level mapping, integration requirements, and growth modelling. We also provide an independent view of the Australian 3PL market, including which providers have genuine capability for your requirements and which are better suited to a different profile.

Procurement process management. We design and run the RFI and RFP process — developing tender documentation, managing provider engagement, facilitating site visits, and building the evaluation scorecard. We ensure you're comparing providers on the dimensions that will determine the quality of the relationship over three to five years, not just the ones that are easy to compare.

Contract negotiation support. We support the commercial negotiation — pricing structure, SLAs, escalation mechanisms, and exit provisions — drawing on benchmarks from comparable Australian 3PL arrangements to ensure you're not paying above market or accepting below-market terms.

Warehousing & Distribution transition management. We manage the transition programme — site readiness, systems integration, stock transfer, parallel running, and go-live — with a dedicated project manager whose job is to get you operational without service disruption.

We work across retail and FMCG, manufacturing, health and aged care, government, and hospitality. The selection methodology is consistent. The right answer for each client is not.

Explore our Warehousing & Distribution services →

Speak to an expert at Trace →

People & Perspectives

What Does a Supply Chain Consultant Do?

Mathew Tolley
March 2026
"Supply chain consultant" gets used loosely. Here's a plain-English breakdown of what they actually do, what engagements look like, and how to know if you need one.

What Does a Supply Chain Consultant Actually Do?

The term "supply chain consultant" gets used loosely. It covers everyone from a freelance logistics analyst reviewing your freight rates to a team of specialists redesigning your entire procurement, distribution, and planning function. If you're trying to work out whether you need one — and what working with one actually involves — here's the plain-English version.

The Short Answer

A supply chain consultant helps organisations identify inefficiency, design better systems and processes, and implement the changes needed to close the gap between where they are and where they should be.

That work spans four broad disciplines: procurement (how you buy), planning and operations (how you forecast, schedule, and execute), logistics and distribution (how you move and store), and workforce planning (how you resource the operation). Most engagements touch more than one.

What Supply Chain Consultants Actually Do Day-to-Day

The work falls into roughly three phases.

Diagnosis. Before recommending anything, a good consultant spends time understanding the current state. That means reviewing data — spend, inventory, service levels, cost-per-unit, supplier performance — and talking to the people who run the operation. The goal is to identify where value is being lost, why, and how much it's costing. This phase usually takes two to six weeks depending on complexity.

Design. Once the problem is understood, the consultant designs the solution. That might mean a new procurement category strategy, a revised warehouse layout, a demand planning process, a workforce scheduling model, or a complete supply chain network redesign. The output is typically a set of recommendations with a business case — what it costs to implement, what it returns, and in what timeframe.

Implementation. This is where a lot of consulting value either gets realised or lost. The best consultants stay involved through delivery — running procurement processes, standing up new systems, training teams, managing suppliers, and tracking whether the benefits being promised are actually materialising. An advisory report that sits in a drawer delivers nothing.

The Types of Problems That Bring Organisations to a Supply Chain Consultant

Organisations typically reach out when something has gone wrong, when they're about to make a significant change, or when they know they're underperforming but aren't sure why.

Common triggers include: costs that have grown faster than revenue; a merger, acquisition, or restructure that has made the supply chain more complex; a compliance requirement that the current operation can't meet; persistent service failures that are affecting customer relationships; a new distribution centre, system, or network decision that needs independent analysis; or a CFO who wants to know why working capital is so high.

Sometimes the trigger is simpler: a new executive who suspects the function has been underinvested, or a board that wants a view on whether the supply chain is a competitive advantage or a liability.

What a Supply Chain Consultant Is Not

A supply chain consultant is not a staffing agency. They're not there to fill a headcount gap or provide an extra set of hands for business-as-usual work. They're there to bring expertise, objectivity, and structured methodology to problems that are difficult to solve from inside the organisation — either because the internal team doesn't have the specialist capability, because they're too close to the problem, or because they don't have the bandwidth to run a major change programme on top of their day job.

A supply chain consultant is also not a software vendor. Some consultants are aligned to specific technology platforms; good ones aren't. The best advice starts with the problem, not with a predetermined solution.

When You Need a Supply Chain Consultant — and When You Don't

You probably need one if: you're about to make a significant investment in infrastructure, systems, or suppliers and want independent analysis before you commit; your supply chain costs are growing but you can't pinpoint why; you're preparing a business case for the board and need the financial modelling to be credible; or you're implementing a major change — new 3PL, new ERP, new network — and want someone who has done it before managing the process.

You probably don't need one if the problem is straightforward and well within your team's capability, or if what you actually need is a permanent hire rather than a project engagement.

How Trace Consultants Can Help

Trace Consultants is an Australian supply chain, procurement, operations, and workforce planning consultancy. We work with organisations across retail, FMCG and manufacturing, health and aged care, government and defence, and hospitality.

Our work spans the full lifecycle — from rapid diagnostics and business case development through to hands-on implementation and benefits realisation. We don't produce reports and disappear. We stay involved until the change is embedded and the numbers have moved.

If you're trying to work out whether a consulting engagement is the right next step, the best starting point is a direct conversation about what you're trying to solve.

Learn more about why clients choose Trace →

Speak to an expert at Trace →

People & Perspectives

Supply Chain Business Case: CFO Approval Guide

Most supply chain business cases fail before they reach the executive table — not because the opportunity isn't real, but because the case isn't built in language a CFO trusts.

How to Build a Supply Chain Business Case Your CFO Will Approve

Most supply chain business cases fail long before they reach the executive table. Not because the underlying opportunity isn't real — it almost always is. They fail because the case is built in the wrong language, quantified with the wrong metrics, and structured in a way that answers questions the CFO isn't asking.

Supply chain leaders are very good at identifying problems. They can articulate the pain of excess inventory, poor forecast accuracy, supplier unreliability, or an ageing warehouse network in precise operational detail. What's harder — and what separates the proposals that get funded from the ones that don't — is translating that operational pain into a financial case that a CFO finds credible and a board can approve.

This guide explains how to build a supply chain business case that gets approved. It covers the financial framework CFOs actually use, how to quantify the four categories of benefit that matter, what an options analysis needs to contain, and the structural and presentational mistakes that kill proposals that should have been funded.

Why Supply Chain Business Cases Fail

Understanding the failure modes is more instructive than starting with best practice. Supply chain business cases fail consistently for the same set of reasons.

They're built in operational language, not financial language. "Improve DIFOT by 8 percentage points" means everything to an operations manager and almost nothing to a CFO. The same outcome, translated into its revenue impact — reduced customer penalties, lower emergency freight costs, retention of at-risk customer contracts — is a completely different conversation. The underlying investment may be identical. The likelihood of approval is not.

The benefits are incomplete. Most supply chain business cases focus on cost reduction and stop there. The two other major benefit categories — working capital improvement and revenue protection or growth — are left on the table. A business case that only addresses one dimension of value is easy to discount. A business case that addresses all four — revenue, cost, working capital, and risk / cost avoidance — is much harder to argue against.

The baseline is wrong. The cost of doing nothing is usually underestimated. Business cases that compare the investment against zero cost ignore the trajectory — the ongoing accumulation of inefficiency costs, the compounding inventory write-off risk, the customer attrition from persistently poor service levels. A credible baseline includes the cost of the status quo over the investment horizon, not just a static snapshot of today.

They're built in isolation. Supply chain business cases that are developed entirely within the supply chain team, without input from finance, often hit a wall the moment they're presented. The financial model hasn't been stress-tested. The assumptions haven't been challenged. The CFO's team encounters the analysis for the first time in the approval meeting, and their first instinct is scepticism. Building the business case collaboratively — with a finance partner at the table from the start — changes the dynamic entirely.

The options analysis is absent or shallow. A business case that presents only one path forward — "do the thing we're proposing" — gives decision makers no framework for comparison. A proper options analysis includes at minimum a do-nothing scenario, a minimum viable intervention, and the recommended approach. It should show the cost, benefit, and risk profile of each, and make clear why the recommended option is the right one.

The CFO's Framework: Four Categories of Value

CFOs evaluate supply chain investments through a consistent lens. Before building any business case, it helps to understand the four value categories they're looking at, and to ensure your case addresses all of them.

1. Revenue Impact

Supply chain performance directly affects revenue — a fact that is frequently underweighted in business cases. Stockouts cost sales. Persistent delivery failures cost customer contracts. Poor availability in retail drives substitution or, worse, abandonment. Long lead times constrain the organisation's ability to respond to demand signals, capping revenue growth at peak periods.

Quantifying revenue impact requires working backwards from operational metrics. If the current stockout rate is 4% and the proposed investment would reduce it to 1.5%, the revenue implication depends on what proportion of stockouts result in lost sales versus substitution — a figure that can often be estimated from customer data or industry benchmarks. The point is to make the connection explicit, not to pretend it doesn't exist because it's harder to quantify than freight cost savings.

2. Cost Reduction

This is where most supply chain business cases are strongest, and rightly so — cost reduction is often the primary financial driver of supply chain investment. The key is to be specific and to trace the savings to P&L line items the CFO can verify.

Cost reduction in supply chain contexts typically spans: direct procurement savings (unit cost reduction through better sourcing or contracts), operational cost reduction (warehouse labour, transport, 3PL fees), quality and returns costs, and administrative cost from process inefficiency. Each of these should be sized against a current-state baseline using actual cost data — not estimates, not industry averages used as a substitute for internal analysis.

3. Working Capital Improvement

Inventory is one of the largest balance sheet items for any business that holds physical stock. A 20% reduction in inventory — achievable through improved demand planning, safety stock optimisation, or supplier lead time reduction — generates a one-time cash release that, for many Australian manufacturers and retailers, represents tens of millions of dollars. It also reduces carrying costs (typically estimated at 20–30% of inventory value annually, including finance, storage, obsolescence, and handling) on an ongoing basis.

Working capital improvement is often the most compelling element of a supply chain business case for a CFO who is focused on return on invested capital (ROIC) or cash generation. It should be calculated and presented explicitly — not bundled into a general "efficiency improvements" line.

4. Risk Reduction and Cost Avoidance

This is the hardest category to quantify but often the most important strategically. Supply chain failures are expensive: an unplanned production stoppage caused by a single-sourced component failure, a regulatory non-compliance event, a major weather event disrupting a distribution centre that hasn't been through a resilience assessment. These events don't appear in the cost base until they happen — and then they appear all at once.

Quantifying risk requires a different methodology: probability-weighted impact modelling rather than direct cost analysis. For each material risk the investment addresses, estimate the probability of the event occurring over the planning horizon and the financial impact if it does. The expected value of risk reduction — probability × impact — is a legitimate financial input to the business case.

Building the Financial Model

With the four value categories defined, the financial model needs to do three things: size each benefit category against a credible baseline, subtract the full cost of the investment including implementation, and present the returns in metrics that CFOs use to make decisions.

Size the benefits conservatively. The most common mistake in supply chain business cases is using optimistic benefit assumptions that can't be defended under scrutiny. A CFO who has been burned by an over-promised business case before will apply a heavy discount to any number that looks aggressive. Present a conservative case, a base case, and an upside scenario — and be explicit about the assumptions driving each. A conservative case that still delivers a strong return is far more credible than an optimistic case that looks impressive on paper.

Include the full cost of the investment. Software licences and implementation fees are obvious. Less obviously, business cases frequently undercount internal resource costs — the team time required to run a procurement process, implement a system, redesign a process, or manage the change. A business case that omits these costs will fail the scrutiny test when finance does its own analysis. Include them upfront.

Present returns in the right metrics. Different CFOs prioritise different return metrics, and a robust business case includes several. Payback period (how long until the investment is recouped) is the most intuitive. Net present value (NPV) captures the time value of money and the total economic value created. Internal rate of return (IRR) enables comparison against alternative uses of capital. Include all three, rather than cherry-picking the one that looks best.

Model the cost of doing nothing. The baseline isn't zero — it's what the business looks like in three years if the investment isn't made. Ongoing inefficiency compounds. Customer attrition from poor service levels accumulates. Inventory continues to grow. An honest cost-of-inaction analysis often makes the investment case stronger than the benefits analysis alone.

Structuring the Options Analysis

A single-option business case is not a business case — it's a funding request. CFOs and boards expect to see options compared, with a clear rationale for why the recommended approach is preferred over the alternatives.

A minimum viable options analysis includes three scenarios. The first is the do-nothing baseline — the current state extended over the investment horizon with its associated cost trajectory. The second is a minimum viable intervention — the lowest-cost path to addressing the most critical pain points, without the full scope of the recommended approach. The third is the recommended investment, which should represent the option with the best risk-adjusted return over the planning horizon.

For each option, present the total cost, the total benefit across all four value categories, the payback period, the NPV, and the key risks. Make the comparison table clean and easy to read — executive decision-making happens quickly, and a cluttered comparison loses the argument before it's been made.

Presenting to the Executive Team

How a business case is presented matters as much as how it's built. A few principles that consistently make the difference.

Lead with the problem, not the solution. The CFO needs to agree that the problem is real and material before they'll engage with the solution. Open with a clear, quantified statement of the current-state cost — not a description of the proposed investment. "Our current supply chain generates approximately $X million in avoidable costs annually, with a further $Y million in working capital unnecessarily tied up in excess inventory" is a better opening than "we are proposing to implement a new planning system."

Bring finance into the room early. The worst time for a CFO to encounter your financial model for the first time is in the approval meeting. Bring a finance partner into the business case development process from the start. Have them stress-test the assumptions. Incorporate their feedback. When the CFO asks hard questions in the room, having a finance partner who helped build the model — and who endorses it — changes the dynamic entirely.

Address the risks explicitly. Every business case has risks — implementation complexity, dependency on supplier behaviour, internal change management requirements. A business case that doesn't acknowledge them looks naive. One that identifies the risks and articulates how they'll be managed demonstrates credibility. Include a risk register — even a simple one — and be direct about what could go wrong and what the mitigation looks like.

Keep the executive summary to one page. The full business case may be twenty pages. The executive summary should fit on one page and contain: the problem statement, the recommended option, the total investment, the return (NPV, payback period), the key risks, and the decision required. Everything else is supporting material.

Common Mistakes That Kill Proposals

A few patterns consistently kill supply chain business cases that should have been funded.

Treating the investment as self-evidently necessary. Supply chain leaders sometimes assume that the operational problems they live with daily are obvious to everyone. They're not. A CFO who isn't close to supply chain operations needs to be brought into the problem before they can care about the solution.

Using industry benchmarks as a substitute for internal analysis. "Industry best practice is X; we're at Y; therefore the gap is worth Z" is a weak argument. CFOs want to see the analysis applied to your organisation's actual numbers — your cost base, your customer data, your inventory position. Industry data is useful as context and calibration, but internal analysis is what makes the case credible.

Confusing gross savings with net value delivered. A procurement initiative that saves $5M in unit costs but requires a $2M system implementation and $1M in ongoing licence fees doesn't simply generate $2M in net savings — the actual picture depends on how costs are treated and over what horizon you're measuring. Capital expenditure is depreciated over its useful life, not expensed upfront, which changes how the investment hits the P&L versus the balance sheet. Ongoing opex reduces the annual savings run-rate directly. And the year in which benefits start to accrue — typically not year one — changes the NPV materially. The key discipline isn't applying a single net savings formula; it's being explicit about what's capex versus opex, when benefits begin, and what the return looks like across each year of the investment horizon. A CFO will do this analysis regardless — your job is to do it first, transparently, so they're validating your model rather than rebuilding it from scratch.

Proposing a programme without a clear first step. Large supply chain transformations can look overwhelming from an approval perspective. Where possible, structure the business case to identify an early-stage proof of value — a pilot, a diagnostic, a defined first phase — that delivers demonstrable results before the full investment is committed. This reduces the risk the executive team is taking on and creates a natural checkpoint for the programme.

How Trace Consultants Can Help

At Trace Consultants, we help Australian businesses build supply chain business cases that get funded — and then deliver on what they promised.

Business case development and financial modelling. We build the financial model from the ground up: baselining current-state costs across all four value categories, quantifying benefits conservatively and credibly, and structuring the options analysis in a format that withstands CFO scrutiny. We work alongside your finance team, not in isolation from them.

Current-state diagnostic. Before a compelling business case can be built, the current-state cost baseline has to be right. We conduct rapid diagnostics across procurement, planning and operations, warehousing and distribution, and supply chain resilience to establish what the true cost of the current state is — including the costs that aren't visible in the P&L until something goes wrong.

Strategy and network design. For businesses evaluating significant network or infrastructure investment — new distribution centres, third-party logistics arrangements, manufacturing footprint changes — we design the options and build the comparative financial analysis that frames the investment decision clearly.

Implementation support. We stay involved through delivery to ensure the benefits committed to in the business case are actually captured — tracking realisation, escalating variances early, and adjusting the programme when the real world diverges from the plan.

We work across retail and FMCG, manufacturing, health and aged care, government, and hospitality. The financial framework for a supply chain business case is consistent across sectors — the numbers and priorities differ.

Explore our Strategy & Network Design services →

Speak to an expert at Trace →

Getting Started: The Diagnostic First

The most common reason a supply chain business case isn't started is that the team doesn't know where to begin with the baseline. The cost base is opaque. The data is fragmented across multiple systems. The team doesn't have the bandwidth to conduct a rigorous current-state analysis on top of running operations.

A targeted diagnostic — typically three to four weeks — changes that. It establishes the current-state cost baseline across the key value categories, identifies the highest-impact improvement opportunities, sizes the potential returns, and produces the raw material from which a CFO-grade business case can be built. It's a faster, lower-risk way to get to a credible case than trying to build one from first principles internally.

If you have a supply chain opportunity you can't yet quantify, or a proposal that's been rejected once and needs rebuilding, that's the right starting point.

The Bottom Line

A strong supply chain business case isn't about finding a way to make the numbers look good. It's about doing the analysis rigorously enough that the numbers are genuinely good — and then presenting them in a way that builds confidence rather than triggering scepticism.

The four-category framework — revenue, cost, working capital, risk — ensures nothing material is left on the table. Conservative assumptions that survive scrutiny are more valuable than aggressive assumptions that don't. And a CFO who has been involved in the analysis is worth more than a CFO who encounters it cold in the approval meeting.

Supply chain investment creates real value. The organisations that capture it are the ones that make the case clearly.

Explore our Planning & Operations services →

Speak to an expert at Trace →

Planning, Forecasting, S&OP and IBP

What Is S&OP and Why Does It Fail?

Mathew Tolley
March 2026
S&OP is one of the most widely adopted planning frameworks in Australian business — and one of the most consistently underdelivered. Here's the honest diagnosis.

What Is S&OP — and Why Do Most Australian Businesses Get It Wrong?

Ask most supply chain or operations leaders in Australia whether their organisation has a Sales and Operations Planning process, and the answer is almost always yes. Ask whether it's actually working — whether it genuinely aligns demand and supply, drives better decisions, and connects operational planning to financial outcomes — and the answer becomes considerably less confident.

S&OP is one of the most widely adopted planning frameworks in Australian business. It is also one of the most consistently underdelivered. Organisations invest in the process, the meetings, sometimes the technology — and then find themselves asking why nothing much has changed. Forecasts are still wrong. Inventory is still too high in the wrong places and too low in the right ones. The executive team still makes decisions in isolation. The monthly cycle still feels like a reporting exercise rather than a planning one.

This article explains what S&OP actually is, what it's supposed to do, why most implementations fall short, and what a high-functioning process looks like in practice. If you're running an S&OP process that isn't delivering, or you're about to implement one, this is the honest guide you need.

What S&OP Actually Is — and What It Isn't

Sales and Operations Planning is a cross-functional business management process that aligns demand and supply across an organisation — and connects that alignment to the financial plan. Done well, it gives leadership a single, integrated view of the business across a rolling planning horizon, and a structured forum for making decisions that balance customer service, inventory, capacity, and cost.

The process typically runs on a monthly cycle, with a planning horizon of 12–18 months, and involves a defined sequence of steps: demand review, supply review, financial reconciliation, and an executive decision-making meeting. Each step builds on the last. The demand review produces an updated, consensus forecast. The supply review tests that forecast against capacity, supply lead times, and inventory positions. The financial reconciliation identifies the gap between the operational plan and the financial plan. The executive meeting is where the key decisions get made — trade-offs between service and cost, investment calls, risk responses.

Integrated Business Planning (IBP) is the more mature evolution of S&OP. It extends the process to a longer planning horizon (typically 24–36 months), integrates strategic planning and financial planning more explicitly, and involves a broader set of executive stakeholders. For the purposes of this article, S&OP and IBP refer to the same fundamental process — the distinction is largely one of maturity and scope.

What S&OP is not is a reporting meeting. It's not a forum for reviewing last month's performance. It's not something the supply chain team does while sales and finance observe. And it's not a technology solution — software supports S&OP, but no system can substitute for the process discipline and organisational commitment that makes it work.

Why S&OP Matters More Than Ever for Australian Businesses

The case for S&OP has never been stronger — or more urgent — for Australian businesses. The operating environment of the last several years has been one of sustained disruption: pandemic-related supply shocks, cost inflation across logistics and raw materials, geopolitical volatility affecting sourcing and trade, and customer expectations that haven't softened despite all of it.

In this environment, the cost of poor planning is significant. Excess inventory ties up working capital and generates write-off risk. Stockouts cost sales, damage customer relationships, and in some sectors — health, defence, food service — have consequences that go beyond the commercial. Unplanned production changes are expensive. Emergency freight is expensive. Poor forecast accuracy makes supplier relationships harder to manage and more costly to maintain.

McKinsey research comparing mature IBP practitioners with organisations that lack well-functioning planning processes consistently shows meaningful advantages for the former across forecast accuracy, inventory efficiency, service levels, and cost performance. The gap between organisations that plan well and those that don't is widening — particularly as supply chains become more complex and planning horizons more uncertain.

For Australian businesses specifically, the planning challenge has particular characteristics. Long import lead times — especially for businesses sourcing from Asia — mean that decisions made today have consequences three to six months out. Seasonal demand patterns, geographic spread across a large continent, and concentrated retail customer bases that exert significant forecasting pressure all add complexity. A well-functioning S&OP process isn't a luxury in this environment. It's an operational necessity.

The Six Reasons Australian S&OP Processes Fail

Understanding why S&OP fails is more useful than describing why it should succeed. The failure modes are remarkably consistent across industries and organisation sizes.

1. It Becomes a Reporting Meeting, Not a Decision-Making Meeting

The most common failure of all. The monthly S&OP cycle gets established, the meetings happen, the slides get presented — and nothing actually gets decided. The demand review is a retrospective on last month's actuals. The supply review is a status update on known issues. The executive meeting is a forum for information sharing, not trade-off resolution.

When S&OP becomes a reporting cycle, it consumes significant organisational time and produces minimal value. People stop attending seriously. The process drifts toward irrelevance, or it survives only as an administrative obligation that everyone quietly resents.

Real S&OP meetings produce decisions. They answer questions like: given this demand outlook, do we build inventory now or accept a service risk later? Do we invest in additional capacity or manage the constraint through customer allocation? Do we accept this margin outcome or reprice? If your S&OP meetings aren't generating decisions of this type, they're not working.

2. Sales Doesn't Engage

This is the second most consistent failure mode — and one of the most damaging. S&OP is a cross-functional process. It only works if the demand side of the organisation brings its genuine best view of the future to the table. When sales teams treat the demand review as someone else's problem — sending a planner to represent them, submitting last month's forecast unchanged, or simply not showing up — the process is operating on half the information it needs.

Sales disengagement usually happens for one of two reasons. Either the process hasn't been designed in a way that creates value for sales — it feels like a burden, not a tool — or there's no accountability for forecast quality, so there's no incentive to invest in it. Fixing this requires both: a process that sales leaders find genuinely useful, and clear ownership and accountability for the demand input.

3. The Numbers Don't Reconcile to the Financial Plan

Many S&OP processes operate in a parallel universe to the financial plan. The operations team runs an unconstrained demand plan. The finance team runs a budget. The two are never explicitly reconciled, and no one is accountable for closing the gap.

The result is that S&OP produces a plan that the organisation operationally follows but that has no connection to what the business committed to financially. When the gap between the operational plan and the financial plan is large — and it often is — leadership loses confidence in both. S&OP becomes a supply chain exercise rather than a business management tool.

Effective S&OP explicitly bridges the operational and financial plans. The financial reconciliation step isn't optional — it's where the process connects to the P&L, the balance sheet, and the cash flow forecast. When that connection is made, S&OP becomes something the CFO and CEO genuinely care about — not just the supply chain team.

4. The Planning Horizon Is Too Short

Most Australian S&OP processes operate with an effective planning horizon of one to three months — regardless of what the nominal horizon is supposed to be. Decisions are being made to solve this month's problem. The 12-month horizon exists on the slide template but isn't meaningfully used.

The problem is that many supply chain decisions — production scheduling, procurement of long lead time materials, capacity investment, promotional planning — require a meaningful forward view to be made well. If you're only planning three months ahead, you're always reacting. You're booking emergency freight, making unplanned production changes, and managing inventory crises that were predictable four months ago.

Extending the effective planning horizon requires better forecast quality at longer horizons, which requires better process discipline around how the forecast is built and reviewed — not just better statistical models.

5. It's Run by Supply Chain, Not the Business

S&OP is often implemented and owned by the supply chain or planning function, and never successfully transitions to being a genuine business management process. The meetings are facilitated by the planning team, attended primarily by operations and supply chain, and escalated to the executive only when there's a crisis.

When this happens, S&OP produces a very good supply plan. What it doesn't produce is business alignment. The strategic context from the executive team doesn't flow down into the operational plan. The operational constraints and trade-offs don't flow up into executive decision-making. The two worlds remain disconnected.

High-functioning S&OP is sponsored and actively participated in by the CEO or COO. The executive meeting is the most important meeting in the S&OP cycle — not an afterthought appended to the operational reviews.

6. The Data Can't Be Trusted

It's almost impossible to run a useful S&OP process on bad data. If the demand plan is built in a spreadsheet that takes two days to compile and is out of date by the time it's presented, decision-makers can't trust it. If inventory positions aren't accurate, supply planning is guesswork. If the financial reconciliation requires a week of manual effort, it happens too late to influence the decisions it should be informing.

Data quality and process infrastructure are genuine prerequisites for S&OP maturity. Not necessarily sophisticated technology — many organisations run effective S&OP on relatively simple tools — but data that is accurate, timely, and accessible to the people who need it.

What a High-Functioning S&OP Process Looks Like

The good news is that the solution to these failure modes is well understood. Organisations that run effective S&OP share several characteristics.

A clearly defined purpose. Everyone involved understands what the process is for — making decisions that align demand and supply and connect operational planning to financial outcomes — and what it isn't for. The meeting design reflects this purpose.

Active cross-functional ownership. Sales, marketing, operations, supply chain, and finance all have defined roles and genuine ownership. There is no passenger seat in a well-run S&OP process.

A rolling financial bridge. Every cycle, the operational plan is explicitly reconciled to the financial plan. Gaps are identified, quantified, and escalated for decision. This is what makes S&OP a business management tool rather than a supply chain exercise.

Decisions, not presentations. The meeting design is built around the decisions that need to be made, not the information that needs to be shared. Information is shared in advance, in writing. The meeting is for discussion and decision.

A meaningful forward horizon. The process genuinely operates across a 12–18 month horizon. Near-term execution decisions are kept separate from medium-term planning decisions. Both get the attention they need — without the urgent overwhelming the important.

Continuous improvement. High-functioning S&OP processes measure their own performance — forecast accuracy, schedule adherence, inventory against plan, financial versus operational plan variance — and use those metrics to improve. They don't just run the cycle. They get better at it.

S&OP Maturity: Where Does Your Organisation Sit?

S&OP maturity develops in stages. Most Australian organisations are sitting somewhere in the middle — they have a process, it runs regularly, but it isn't delivering the full value it could.

A useful way to assess maturity is to ask a few direct questions:

  • Does your S&OP process produce a consensus demand forecast that sales genuinely owns and defends?
  • Is there an explicit financial reconciliation every cycle?
  • Does your CEO or COO actively participate in the executive meeting?
  • Can you make a meaningful planning decision using the 12-month horizon, or do you only really trust the next 30–60 days?
  • Do the decisions made in S&OP meetings get tracked and executed?

If the honest answer to most of these is no, there's a meaningful maturity gap — and a meaningful value opportunity.

How Trace Consultants Can Help

At Trace Consultants, we help Australian businesses design, implement, and improve S&OP and IBP processes that actually work — not just on paper, but in the room, every month, producing decisions that improve business performance.

S&OP diagnostic and maturity assessment. We assess your current process against best practice across process design, cross-functional engagement, financial integration, data infrastructure, and meeting effectiveness. We identify the specific gaps that are limiting your S&OP value and prioritise them by impact.

Process design and redesign. We design S&OP processes from the ground up for organisations implementing for the first time, and redesign existing processes that have drifted into reporting cycles. We work with your leadership team to define purpose, roles, accountabilities, meeting design, and the financial bridge — before we run a single meeting.

Planning & Operations implementation support. We embed with your team through the first several cycles of a new or redesigned process — facilitating meetings, coaching participants, troubleshooting issues in real time, and building the organisational muscle that makes S&OP sustainable.

Demand planning capability. Weak S&OP almost always starts with weak demand planning. We help organisations build statistical forecasting foundations, consensus demand review processes, and sales accountability frameworks that produce a demand plan worth planning against.

Technology enablement. We help organisations assess whether their current planning tools are fit for purpose, and support the selection and implementation of planning technology where it's needed — including Advanced Planning Systems (APS) that unlock the data quality and scenario planning capability S&OP needs to reach full maturity.

We work across retail and FMCG, manufacturing, health and aged care, government, and hospitality. The S&OP challenges are consistent across sectors. The context and constraints differ, and that's where experience matters.

Explore our Planning & Operations services →

Speak to an expert at Trace →

Getting Started: The Honest First Step

The starting point for any S&OP improvement program is an honest assessment of where you are. Not where you aspire to be, and not where the process documentation says you should be — where you actually are.

That means sitting in the meetings as they currently run, reviewing the outputs they produce, talking to the participants about what they find useful and what they don't, and testing the data quality that underpins the process. Most of the time, that diagnostic produces a clear picture within a few weeks — and a prioritised list of changes that would move the needle quickly.

The organisations that improve S&OP fastest are those that start with process before technology, secure genuine executive sponsorship before running the first meeting, and are willing to be honest that the current process isn't delivering — rather than defending it because it's been in place for years.

If your S&OP process is running but not working, the gap between what you have and what you could have is probably smaller than you think — and the return on closing it is larger.

The Bottom Line

S&OP done well is one of the highest-leverage management investments an Australian business can make. It improves forecast accuracy, reduces inventory cost, lifts service levels, and connects operational planning to financial outcomes in a way that makes the whole business run better.

Most organisations have the process in name. The opportunity is in building it in practice — with the right design, the right cross-functional commitment, and the right leadership to make it a genuine business management tool rather than a monthly supply chain meeting.

Explore our Planning & Operations services →

Speak to an expert at Trace →

Workforce Planning & Scheduling

Workforce Planning for Aged Care Australia

With 215 mandatory care minutes per resident per day and a 24/7 RN requirement, aged care workforce planning has become one of the most operationally complex challenges in the sector.

Workforce Planning for Aged Care: A Practical Guide for Australian Providers

There's no workforce challenge in Australia quite like aged care. You're operating in a sector with chronic staff shortages, high turnover, legislated care minute requirements, a 24/7 registered nurse obligation, and a regulator that is now issuing Enforceable Undertakings to providers who fall short. Meanwhile, the population you're caring for is growing, the complexity of care needs is increasing, and the financial margin for error is razor thin.

Workforce planning in this environment isn't an HR function. It's an operational and strategic imperative — and providers who don't treat it that way are exposed on multiple fronts simultaneously: regulatory risk, quality risk, cost blowout from agency reliance, and staff turnover that perpetuates the whole cycle.

This guide is for CEOs, COOs, directors of care, and finance leaders at residential aged care and home care providers across Australia. It covers what best-practice workforce planning looks like in the current regulatory environment, where most providers are falling short, and what practical steps actually move the needle on cost, compliance, and care quality.

The Regulatory Context Has Changed — Permanently

Any workforce planning conversation in residential aged care now starts with the regulatory framework — because it defines the minimum floor your model has to deliver against.

From 1 October 2024, residential aged care providers are required to deliver 215 minutes of direct care per resident per day, including 44 minutes of registered nurse time. Every facility has its own specific target, calculated based on the acuity of its resident population. These aren't aspirational benchmarks — they're mandatory, reported quarterly, and audited.

Sitting alongside that is the 24/7 registered nurse requirement, which has been in place since 1 July 2023. A registered nurse must be on site and on duty at every residential facility around the clock, every day of the year.

The Aged Care Quality and Safety Commission has made clear it will pursue providers who consistently fail to meet these requirements. As of early 2025, Enforceable Undertakings — legally binding agreements requiring immediate corrective action — had been issued to 11 providers operating 27 homes. The Commission's messaging is unambiguous: compliance is non-negotiable.

The new Aged Care Act 2024, which commenced on 1 November 2025, further strengthens workforce obligations. Providers must now demonstrate they understand and actively manage their workforce needs, use direct employment wherever possible, minimise contractor and agency reliance, and maintain documented workforce strategies aligned to the new strengthened Quality Standards.

This is the baseline. Everything in your workforce model has to be built on top of it.

Why Most Aged Care Providers Are Struggling

Understanding the regulatory requirements is one thing. Meeting them consistently, cost-effectively, and with a workforce that stays, is another.

The fundamental problems most providers face aren't new — but they've intensified:

Chronic staff shortages. Attraction, retention, training, and sustainability are the four themes that have emerged consistently across every workforce engagement forum run by Ageing Australia in 2025. The pipeline of people entering the sector isn't keeping pace with demand. Turnover in some facilities exceeds 25% annually. Every vacancy creates pressure on remaining staff, which accelerates burnout and more departures.

Over-reliance on agency labour. When direct staff aren't available, agency becomes the default. Agency solves the immediate scheduling problem but creates a financial and operational one. Agency rates can be 40–80% higher than equivalent direct employment costs. Agency workers typically have limited familiarity with residents, documentation systems, and clinical protocols. And under the new Act, providers are explicitly required to minimise their use.

Reactive rostering. Many providers are still managing rosters day-to-day — reacting to absences and vacancies rather than planning proactively against demand. The result is costly last-minute agency bookings, fatigued staff who've worked extra shifts, and care minute shortfalls that trigger regulatory attention.

Poor workforce data. A significant number of providers lack a single, accurate view of their workforce — who they have, what qualifications they hold, how many hours they're working, and how that maps against their care minute obligations. Without that visibility, you can't plan. You're managing by feel.

Fragmented technology. Payroll, rostering, HR, and clinical systems are often separate, poorly integrated, and not designed to give operational leaders the real-time visibility they need. Compliance reporting becomes a manual exercise and care minute calculations are retrospective rather than forward-looking.

What Good Workforce Planning Actually Looks Like

Best-practice workforce planning in aged care isn't a single program or a new software system. It's a set of interconnected disciplines that, when working together, give providers control over their workforce cost, compliance, and quality — simultaneously.

1. Demand Modelling Against Care Minute Obligations

The starting point is understanding your demand — not in a general sense, but with precision. What are your facility-level care minute targets? What does that translate to in terms of required hours, by role type (RN, EN, PCW/AIN), by shift, by day of week?

Most providers have this number somewhere — but it often sits in a spreadsheet that gets updated quarterly. Best-practice demand modelling integrates this with resident acuity data, seasonal patterns (admissions, hospitalisations, respite peaks), and known scheduling constraints to produce a staffing requirement profile that's dynamic, not static.

When you know your demand profile precisely, you can roster to it — rather than rostering from habit and discovering shortfalls after the fact.

2. Workforce Supply Analysis

Demand modelling is only useful when set against a clear picture of supply. How many FTE do you have, by role? What's their contracted hours profile? What's your average leave utilisation — planned and unplanned? What proportion of your workforce is casual and therefore subject to availability constraints?

Providers who do this well produce a workforce supply curve that maps available hours against required hours across every shift pattern. Gaps become visible weeks in advance, not the morning of a shift. That visibility is what allows you to recruit proactively, redeploy staff across sites where needed, and reduce last-minute agency dependency structurally — not just operationally.

3. Smart Rostering

Rostering in aged care is operationally complex. You're dealing with Award obligations, penalty rates, qualification requirements, continuity of care expectations (the same worker seeing the same resident where possible), and now a regulatory environment that will scrutinise your care minute delivery at facility level.

Smart rostering means building rosters that:

  • Meet care minute targets by shift and by day, not just on average
  • Respect Award entitlements and minimise unnecessary penalty rate exposure
  • Maintain continuity where possible — particularly for residents with dementia or complex behavioural needs
  • Account for planned leave without creating unplanned agency dependency
  • Are built weeks in advance, not days

This is where technology makes a genuine difference — but only if it's being used properly and the underlying workforce model is sound.

4. Reducing Agency Dependency Structurally

Agency spend is a symptom of workforce planning failure — and treating it as a symptom is the only way to meaningfully reduce it. Tactical approaches (cutting agency on short-term budget pressure) don't work and create care quality risk. Structural approaches do.

The levers that reliably reduce agency dependency are:

Building a flexible internal workforce. A well-managed bank of casual and part-time staff who are engaged, inducted, and familiar with your systems provides a buffer against absence without the cost and quality risk of agency. This requires investment in how you engage and retain casual staff — many providers ignore casuals until they need them and then wonder why availability is poor.

Cross-site pooling. For providers with multiple facilities in a region, deploying staff across sites — with appropriate travel arrangements and advance notice — reduces the circumstances where any single site faces a shortage that can only be filled by agency. This requires investment in portability: induction, credentialling, and scheduling systems that work across sites.

Reducing turnover. Every time a permanent staff member leaves, you face an immediate gap (agency cost), a recruitment cost, an onboarding cost, and a period of reduced productivity. The hidden cost of turnover in aged care is consistently underestimated. Providers who have done the analysis often find their fully loaded cost of a single RN departure exceeds $30,000 when agency cover, recruitment fees, and training are included. Investing in retention — through scheduling quality, workload management, recognition, and career pathways — has a direct financial return, not just a care quality one.

5. Workforce Strategy and Capability Planning

Beyond the operational horizon, best-practice workforce planning includes a medium-term strategy that addresses supply pipeline, capability development, and structural design.

How many RNs will you need in three years, given your expected bed growth and acuity trends? Where will they come from, given the national shortage? What does your enrolled nurse and personal care worker pipeline look like? How are you developing internal talent into supervisory and clinical leadership roles?

These aren't questions most providers are answering systematically. But in a sector where supply constraints are structural and the regulatory bar keeps rising, providers that plan their workforce three to five years out will be significantly better positioned than those managing quarter to quarter.

The Financial Case for Getting This Right

Workforce is the largest cost line in any aged care provider's P&L — typically 60–70% of total operating costs for residential services. The financial stakes of getting workforce planning wrong are enormous.

Consider a residential facility with 120 beds. A poorly managed roster with consistent agency reliance at even two or three shifts per day can generate $800,000–$1.2M in incremental agency cost annually above what a well-managed direct workforce would cost for the same hours. That's before factoring in the regulatory risk cost of care minute shortfalls.

Providers that invest seriously in workforce planning capability typically see:

  • Agency spend reduction of 25–40% over 12–18 months through structural workforce model improvement
  • Turnover reduction of 10–20 percentage points through scheduling quality, workload balance, and workforce engagement improvements
  • Care minute compliance improvement from reactive management to consistent, proactive delivery
  • Award compliance risk reduction from smarter rostering that minimises unintended breaches

These are not small numbers. For most providers, the return on a serious workforce planning program is measured in millions — and it also directly improves the quality of care delivered to residents.

The New Aged Care Act: What It Means for Your Workforce Model

The Aged Care Act 2024 introduces a rights-based framework that has direct implications for how providers structure and manage their workforces.

The Strengthened Aged Care Quality Standards, which came into force with the new Act, explicitly require providers to:

  • Document and implement a workforce strategy
  • Demonstrate they understand their workforce needs and plan for the future
  • Use direct employment wherever possible and minimise the use of contractors and agency staff
  • Have strategies in place to manage workforce shortages, absences, and vacancies
  • Support and maintain a psychologically safe aged care workforce

Workforce planning is no longer just good practice. It's a documented compliance obligation. Providers without a credible, evidence-based workforce strategy — and the operational systems to execute against it — are exposed under the new regulatory framework.

The new Care Minutes Performance Statement, required from the 2025–26 financial year, adds an audit obligation on top of the reporting obligation. Providers must engage a registered company auditor to review their Care Minutes Performance Statement. This elevates workforce data accuracy from an operational concern to a financial reporting one.

How Trace Consultants Can Help

At Trace Consultants, we have deep experience helping health and aged care providers design and implement workforce planning models that work — operationally, financially, and under the new regulatory framework.

Workforce demand modelling. We translate your care minute obligations, resident acuity data, and service delivery model into a precise workforce demand profile — by role, by shift, by site. This gives you the foundation for everything else.

Workforce supply analysis and gap identification. We analyse your existing workforce against your demand profile, identifying the specific gaps — by role type, skill level, and location — that are driving agency dependency and compliance risk. We quantify the cost of the current model versus a well-structured alternative.

Rostering design and optimisation. We work with your operational leadership to design rostering frameworks that meet care minute targets, manage Award exposure, support continuity of care, and are executable by your team. We don't hand over a model and walk away — we build the capability to run it.

Agency reduction programs. We design and implement structured programs to reduce agency dependency through workforce pool development, cross-site deployment models, and retention improvement. These programs are built around your specific workforce composition and operational context — not generic benchmarks.

Workforce Planning & Scheduling capability uplift. For providers with limited internal workforce planning capability, we build it — through embedded support, process design, technology configuration, and knowledge transfer.

Workforce strategy development. We help providers develop the documented workforce strategy required under the new Aged Care Act — grounded in data, realistic about your supply constraints, and specific enough to demonstrate genuine planning to the regulator.

We've delivered workforce planning and scheduling programs across residential aged care, home care, and community health — including for national providers managing workforces across multiple states. We understand the Award complexity, the regulatory environment, and the operational realities of running aged care services at scale.

Explore our Workforce Planning & Scheduling services →

Speak to an expert at Trace →

Getting Started: The Diagnostic First Step

The most common mistake providers make is jumping to solutions — a new rostering system, a recruitment drive, an agency preferred supplier panel — before they understand the actual shape of the problem.

The right starting point is a workforce diagnostic: a structured, data-driven assessment of your current workforce model against your demand obligations. Typically a three-to-four-week exercise, it answers the questions most providers can't answer today: Are you structurally staffed to meet your care minute targets? Where is your agency spend actually coming from? What's the real cost of your current turnover rate? What would a well-designed workforce model for your organisation actually look like?

From that diagnostic, you get a prioritised action plan — specific interventions ranked by impact and feasibility, with a realistic implementation sequence and an honest projection of the financial and compliance benefits.

That's the starting point for every successful workforce transformation we've delivered in the sector. Not a system. Not a policy. A clear-eyed understanding of where you are and a credible plan for getting somewhere better.

The Bottom Line

Aged care workforce planning has moved from a back-office scheduling challenge to a boardroom-level strategic and compliance obligation. The regulatory framework is tighter, the penalties for non-compliance are real, and the financial cost of getting it wrong — in agency spend, turnover, and regulatory exposure — is significant and growing.

Providers that invest in genuine workforce planning capability — demand modelling, smart rostering, structured agency reduction, and documented workforce strategy — don't just reduce cost and manage compliance risk. They deliver better care. Staff who are well-scheduled, not burned out, and working in a stable team environment provide more consistent, higher-quality care to residents. That's the case to take to your board.

The workforce challenge in aged care is real and structural. But it's manageable — with the right approach, the right data, and the willingness to plan rather than react.

Explore our Workforce Planning & Scheduling services →

Speak to an expert at Trace →

Procurement

Procurement Cost Reduction: Australia Guide

Procurement is one of the biggest cost levers available to Australian organisations — yet most are leaving savings on the table. Here's how to change that in 2026.

How to Reduce Procurement Costs in Australia: A Practical Guide for 2025–2026

If your organisation is feeling the squeeze on costs, you're not alone. Across Australia, supply chain leaders are navigating rising input costs, sustained supplier price pressure, and tightening margins — all while being asked to maintain or improve service levels.

Procurement is one of the most powerful levers available. Done well, strategic procurement reform can unlock 10–20% cost savings across direct and indirect spend categories. But most Australian organisations aren't getting anywhere near that. Not because the opportunity isn't there — but because their approach to procurement is transactional rather than strategic.

This guide breaks down the strategies procurement leaders, CFOs, and operations directors are using to find hidden savings, strengthen supplier relationships, and build more resilient supply chains — without sacrificing quality or service. Whether you're in retail, healthcare, government, hospitality, or manufacturing — the fundamentals are the same. The numbers differ. The execution varies. But the framework works.

Why Procurement Is Still an Untapped Lever

Most organisations treat procurement as a back-office function — something that happens when someone needs to buy something. Purchase orders get raised, invoices get approved, and contracts roll over without scrutiny. Category management exists in name only. Supplier performance rarely gets formally measured.

The result? Spend leakage. Duplicate suppliers. Maverick purchasing that bypasses negotiated rates. Prices that haven't been benchmarked in years. Contract terms that favour the supplier, not the buyer.

The scale of the problem surprises most leadership teams when they first see it clearly. Organisations without structured strategic sourcing consistently overpay by 10–25% across many indirect categories. For an organisation with $50M in annual procurement spend, that's $5–12.5M in potential savings every year — recurring, not one-off.

The good news? You don't need to overhaul your entire procurement function overnight to start capturing that value. Incremental, well-targeted interventions generate significant returns quickly. And early wins build the momentum and internal confidence for more.

1. Start With Spend Visibility

You can't optimise what you can't see. The first step in any procurement improvement program is spend analysis — building a clear, categorised view of where your money is going, who you're buying from, and under what terms.

For most organisations, this is harder than it sounds. Spend data is fragmented across ERP systems, corporate credit cards, purchase orders, and manual invoices. Supplier names are inconsistently formatted. Categories are poorly coded or missing entirely.

A well-built spend analysis cuts through that noise. It reveals:

  • Your top 20 suppliers by spend and the concentration risk that creates
  • Categories where you have too many suppliers and limited leverage
  • Spend that falls outside contract — maverick purchasing bypassing negotiated rates
  • Categories that haven't been taken to market in more than three years
  • Tail spend that could be consolidated, automated, or removed entirely

Consider a large Australian hospitality business: a structured spend analysis revealed that maintenance services — a category assumed to be well-managed — were being delivered by more than 60 separate contractors across three states, with no consistent scope, pricing, or performance measurement. Consolidating to a smaller preferred supplier panel saved more than 15% on total category spend and significantly reduced management overhead.

The lesson: spend visibility isn't just a data exercise. It's the foundation for every savings opportunity that follows.

2. Category Management: Treat Spend Like a Portfolio

Once you have visibility, category management gives you the framework to act on it systematically. Rather than treating every purchase in isolation, category management groups related spend together and develops a sourcing strategy that reflects the specific dynamics of each category — its supply market, your organisation's leverage, the risk profile, and the value opportunity.

The standard approach uses a category prioritisation matrix assessing two dimensions: spend value (how much you're spending) and supply complexity (how difficult the market is to navigate). Categories in the high-spend, lower-complexity quadrant are your fastest opportunities. Categories that are high-spend and high-complexity require more sophisticated strategies, but they offer the largest long-term rewards.

Government and public sector organisations have a particularly significant opportunity here. Government procurement is often fragmented across departments with limited central visibility. Aggregating demand and moving to whole-of-government panel arrangements for common categories — IT, professional services, facilities maintenance — consistently delivers savings of 10–20% and measurably improves supplier accountability.

For health and aged care providers, category management applied to consumables, medical supplies, and food and beverage COGS can release savings that flow directly back into patient care investment. The categories are often large, the supplier markets are competitive, and the contracts are frequently out of date.

The critical success factor isn't the strategy document. It's execution. Category plans that sit in a spreadsheet deliver nothing.

3. Strategic Sourcing: Take Your Contracts to Market

One of the most direct ways to reduce procurement costs is straightforward: take categories to market. It sounds obvious — but many Australian organisations are operating on contracts that haven't been tested competitively for five, seven, or even ten years.

Markets change. New suppliers enter. Technology disrupts established models. Pricing benchmarks shift. An organisation that hasn't tested its freight contract in four years is almost certainly not paying market rates — and its incumbent provider knows it.

Strategic sourcing is a structured process for going to market effectively. Done well, it involves:

  • Market sounding — understanding who the active suppliers are and what a realistic price range looks like before you issue a tender
  • Requirements definition — being precise about what you're buying and building specifications that allow suppliers to compete on equal terms
  • Supplier engagement — running a transparent, well-organised process that attracts credible responses
  • Evaluation and negotiation — using weighted criteria that reflect your actual priorities, then negotiating terms — not just headline rates
  • Contract governance — making sure the benefits you negotiated are actually delivered, with clear performance measurement and escalation mechanisms built in from day one

For indirect categories — facilities maintenance, professional services, insurance, fleet, IT, print, travel — strategic sourcing exercises routinely identify savings of 8–20%. For direct materials and logistics, the savings vary by category but are consistently significant.

A structured strategic sourcing program across five priority categories can typically be completed in three to six months and generate returns that far exceed the investment in running the process.

4. Supplier Rationalisation: Fewer, Better Suppliers

More suppliers is not better. For most organisations, a long tail of small, unmanaged suppliers represents cost, risk, and administrative burden — not flexibility or competition.

Deliberate supplier rationalisation — reducing the number of active suppliers in a category and concentrating spend with a smaller, better-managed panel — consistently delivers across cost, compliance, and performance simultaneously.

When you consolidate spend, you increase leverage with preferred suppliers. That creates pricing pressure and contract improvement opportunities you simply don't have when spend is scattered. You also reduce the cost of purchase-to-pay processing — fewer invoices, fewer approvals, fewer relationships to maintain. And you create the conditions for genuine supplier partnerships, where suppliers invest in understanding your business and bring innovation and value-add alongside competitive pricing.

For large, complex organisations — integrated resorts, hospitals, government departments — supplier rationalisation can be one of the fastest and most impactful cost levers available. It does require buy-in from the business units managing those supplier relationships, which means this is as much a change management exercise as a procurement one.

5. Contract Management and Value Realisation

Having a good contract means nothing if it isn't actively managed. Contract value leakage — the gap between savings negotiated and savings actually realised — is one of the most common and least-discussed problems in Australian procurement.

It happens in multiple ways. Agreed pricing isn't loaded into the ERP correctly. Volume thresholds that trigger discounts are never reached because the business keeps ordering outside the preferred supplier. Service level requirements are written into the contract but never formally measured. Price escalation clauses are triggered automatically without scrutiny.

Active contract management — assigning clear ownership for key contracts, tracking performance against agreed KPIs, and reviewing pricing and terms at regular intervals — converts negotiated savings into realised savings. Without it, you're leaving money on the table that you already negotiated for.

Organisations that conduct regular contract performance reviews frequently recover value in the form of penalties or service credits that had accrued but were never claimed. The savings were already contractually available — they just weren't being collected.

6. Getting the Procurement Operating Model Right

Even excellent category strategies and rigorous supplier negotiations deliver limited value if the procurement operating model is broken. The operating model determines how procurement is structured, how decisions get made, how the function engages with the business, and what capabilities are in place.

Common operating model failures in Australian organisations include:

  • Procurement too centralised — creating bottlenecks and frustrating business units that need speed and flexibility
  • Procurement too decentralised — no central oversight, no spend visibility, no leverage with suppliers
  • Category management roles that exist on an org chart but have zero capacity for strategic work because they're buried in transactional purchasing
  • Technology that doesn't support the process — or is poorly configured and quietly avoided by the team

Designing a procurement operating model that actually works requires honest assessment of current state, clear definition of what "good" looks like for your organisation's size and complexity, and a pragmatic roadmap from here to there. It's not a one-size-fits-all exercise.

7. Technology: Enabler, Not Shortcut

Procurement technology is evolving rapidly. Source-to-pay platforms, e-procurement systems, spend analytics tools, supplier portals, and AI-enabled contract analysis are becoming more capable and more accessible.

But technology is an enabler, not a solution in itself. The organisations that extract the most value from procurement technology are those that have the fundamentals right first — clear category strategies, well-designed processes, capable people — and then use technology to scale and automate those processes.

The trap is implementing a sophisticated procurement platform on top of broken processes and fragmented data. The result is a more expensive version of the original problem.

For most Australian organisations, the highest-priority technology investments are spend analytics (to get visibility) and a basic e-procurement system (to enforce compliance and reduce tail spend leakage). More advanced capabilities — dynamic discounting, AI contract review, supplier collaboration portals — make sense once the fundamentals are in place and the team has the capacity to use them properly.

How Trace Consultants Can Help

At Trace Consultants, we specialise in helping Australian organisations unlock the value in their procurement function — practically, efficiently, and with measurable results.

Spend analysis and diagnostics. We build spend cubes and category maps that give organisations clear visibility over their expenditure for the first time. We identify where the savings opportunities are, size them, and develop a prioritised roadmap for acting on them.

Category management. We design and implement category management programs that go beyond strategy documents. We build the category plans, run the market testing, support negotiations, and make sure the opportunities identified translate into signed contracts and realised savings.

Strategic sourcing. We run end-to-end strategic sourcing exercises across any category — facilities maintenance, food and beverage, logistics, IT, professional services, medical consumables, and more. Our approach is structured, competitive, and commercially rigorous.

Procurement operating model design. We assess your current model honestly, identify the gaps between current and desired state, and develop a practical design for a function that works — with the right structure, governance, process, technology, and capability. You can learn more about our procurement services here.

Implementation support. We don't deliver recommendations and walk away. We embed with your team, support execution, transfer capability, and measure results. Our goal is lasting impact, not a report that gathers dust.

We work with organisations across retail and FMCG, health and aged care, government and defence, hospitality and property, and manufacturing. Whatever sector you're in, the procurement fundamentals are consistent — and the savings opportunities are real.

Getting Started: Where to Begin

The natural question is: where do we start? For most organisations, the highest-value starting point is spend visibility.

Before you can prioritise categories, design sourcing strategies, or build supplier panels, you need to understand what you're spending, where, and with whom. A structured spend analysis — typically a two-to-four-week exercise — gives you that foundation and usually pays for itself in the first category you work on.

From there, a category prioritisation workshop with your leadership team turns the data into a sequenced improvement agenda: which categories to work on first, in what order, and with what investment.

The first project — typically a strategic sourcing exercise on one or two priority categories — generates immediate savings and builds internal confidence in the process. That confidence matters. Procurement transformation isn't purely a technical challenge. It's a change management challenge. Getting early wins, measuring them clearly, and communicating them visibly is what creates the momentum for sustained, compounding improvement.

The Bottom Line

Procurement cost reduction isn't a one-time project. It's an ongoing discipline that, when embedded in how an organisation operates, generates compounding returns over time.

The organisations that get this right don't just save money. They build more resilient supply chains, develop stronger supplier relationships, improve compliance and governance, and free up the operational bandwidth that was previously consumed by inefficiency and firefighting.

The opportunity is significant. For most Australian organisations, a structured procurement improvement program delivers 10–20% savings across priority categories — with higher uplifts available in areas that haven't been reviewed in years.

The starting point is understanding where you are today, being honest about the gap, and committing to a structured approach that goes beyond one-off quick fixes. Trace Consultants helps Australian organisations take that journey — from spend analysis and category management through to operating model design and full strategic sourcing programs.

Explore our procurement services →

Speak to an expert at Trace →

Resilience & Risk Management

Building Resilient Agricultural Supply Chains in an Era of Geopolitical Volatility

Caroline Chen
March 2026
Geopolitical volatility is reshaping global trade. For Australia's export-reliant agricultural sector, building resilient supply chains isn't optional anymore. Learn how to turn uncertainty into competitive advantage through diversification, visibility, and strategic planning.

At an alarming pace, the global business environment is being reshaped by compounding geopolitical forces. Trade tensions, armed conflicts, shifting alliances, economic sanctions, climate-driven migration and resource nationalism are no longer isolated disruptions: they are structural realities. Importantly, Australia exports around 70% of the total volume of agriculture, fisheries and forestry production. Hence, as a heavily globalised sector, the agricultural industry stands at the frontline of this transformation. In this new era of geopolitical volatility, building resilient agricultural supply chains is no longer optional: it is imperative for survival and competitiveness.

Past Events

Recent global developments have demonstrated how quickly agricultural trade flows can be disrupted. Trade disputes such as those between Australia and China, sanctions following conflicts like the war between Russia and Ukraine and strategic competition between the United States and China have all reshaped commodity markets. For example, in May 2020, China imposed steep antidumping and countervailing tariffs on Australian barley of over 80%, effectively shutting off Australia’s largest barley market, where previously China accounted for around 60-75% of Australian barley exports. This forced Australian exporters to shift barley to alternative markets such as the Middle East and Mexico at lower prices.  Such disruptions illustrate how dependent Australia’s agricultural sector is on stable geopolitical relationships, whose frequency is only increasing in the current volatile landscape.

Key Vulnerabilities in Australian Agricultural Supply Chains

Australian agricultural supply chains possess inherent characteristics that increase their exposure to geopolitical shocks:

1. Concentrated Export Markets

When a significant proportion of exports is directed toward a small number of trading partners, diplomatic tensions can cause outsized economic impact. Market concentration creates leverage for importing nations and risk exposure for producers.

2. Long and Complex Logistics Networks

Australian agricultural exports depend on maritime shipping routes that traverse contested waters and geopolitical chokepoints. Disruptions to global shipping, port congestion, or sanctions regimes can quickly escalate costs and delays.

3. Input Dependencies

Farmers rely on imported fertilizers, agrochemicals, machinery parts, and fuel. Conflicts or sanctions affecting major producers — particularly in Eastern Europe or the Middle East — can constrain supply and drive input inflation.

4. Limited Storage and Perishability

Unlike many manufactured goods, agricultural commodities often require temperature-controlled storage and have limited shelf lives. Delays can result in spoilage and financial losses.

Adapting Supply Chains for Resilience

For decades, supply chains were optimised for cost efficiency under assumptions of geopolitical stability. Today, that model must evolve to prioritise resilience. Key strategies include:

1. Market Diversification

Reducing reliance on any single export destination is fundamental. Expanding trade relationships across Southeast Asia, India, the Middle East, and emerging African markets can distribute risk more evenly. Trade agreements and diplomatic engagement play a crucial enabling role here. Diversification is not merely about geography — it also includes product differentiation. Moving up the value chain into processed and branded goods can reduce exposure to commodity price swings.

2. Strategic Stockpiling and Buffer Capacity

Holding higher levels of inventory, whether inputs such as fertilizers or export-ready commodities, may increase short-term costs but provides insurance against sudden disruptions. Cold storage investments and inland logistics hubs can strengthen domestic flexibility.

3. Digital Supply Chain Visibility

Technologies such as blockchain, IoT tracking, and predictive analytics can enhance real-time visibility across supply chains. Early detection of disruptions enables faster response. Transparent data-sharing between producers, exporters, freight operators, and policymakers is critical.

4. Regionalising Supply Chains

Shortening supply chains through regionalization or nearshoring can significantly reduce exposure to global disruptions. By producing and sourcing closer to home, Australia can mitigate risks from contested trade routes, geopolitical chokepoints, and import dependencies. While complete self-sufficiency is unrealistic, strategic domestic capability can buffer external shocks.  

5. Leveraging Technologies

Technologies such as climate-controlled storage and transport and modular, solar-powered cold rooms increase the efficiency of logistics infrastructure while reducing post-harvest losses.  

Climate Change: The Geopolitical Multiplier

Climate change amplifies geopolitical volatility. Extreme weather events affect harvest volumes, commodity prices, and food security, potentially crippling infrastructure and supply chains. Rising food scarcity in vulnerable regions may turn agricultural exports into instruments of geopolitical leverage.

For Australia, climate adaptation—drought-resistant crops, water management innovations, and regenerative farming—must be integrated into supply chain strategies. Ensuring stable production under climatic stress directly supports export reliability and ensures long term food security.

From Vulnerability to Strategic Advantage

Geopolitical volatility, while risky, also presents opportunities. Nations that can reliably supply high-quality food gain strategic importance.

Australia’s strengths—robust regulation, advanced agricultural research, and a reputation for safe, high-quality produce—position it to capitalise on these opportunities. By embedding resilience into logistics, trade relationships, and input sourcing, the sector can turn uncertainty into competitive advantage.

For Australia, resilience is not just risk mitigation—it safeguards economic stability and national food credibility. Diversification, digital transparency, domestic capability building, and proactive diplomacy are pillars of this transformation.

The era of predictable globalization has ended. Agricultural supply chains must now operate within a fragmented and strategically contested global landscape. Farmers, traders, and policymakers must prepare for a world where disruption is the baseline.

How Trace can help:

At Trace, we assist agricultural producers, processors, and exporters in translating geopolitical risk into actionable supply chain strategy. Our services include:

  • Mapping end-to-end supply chains to identify exposure to markets, inputs, and logistics corridors.
  • Quantifying concentration risk and modelling the financial impact of plausible disruption scenarios.
  • Designing diversification strategies and optimising logistics networks.
  • Strengthening cold chain capability and building dual-sourcing and inventory frameworks for critical inputs.
  • Supporting traceability and compliance to meet emerging regulatory requirements efficiently.

Most importantly, we focus on implementation. Resilience is practical, it is embedded in contracts, systems, governance, and operating models. In an export-reliant industry, deliberate resilience protects margins, preserves market access, and keeps products moving when the external environment shifts.

Now is the time to act to future-proof Australia’s agricultural supply chains. If your agricultural supply chain is exposed to geopolitical risk, let's talk. Our team can help you map vulnerabilities, model scenarios, and build practical resilience into your operations before the next disruption hits.

Technology

Trace Partners with Optilogic to Accelerate AI-Powered Supply Chain Design

Mathew Tolley
March 2026
Trace has partnered with Optilogic, the AI-first supply chain design company, to deliver advanced network optimisation and scenario modelling capabilities. The partnership brings world-leading design tools to Australian organisations navigating supply chain complexity.

Trace Consultants, Australia's specialist supply chain and operations consultancy, today announced a strategic partnership with Optilogic, the AI-first supply chain design company.

The partnership will strengthen and expand Trace's advanced analytics and supply chain design capabilities through Optilogic's AI-powered platform for network optimisation, scenario modelling, and strategic decision-making.

Trace delivers high-impact solutions across supply chain strategy, network design, procurement, workforce planning, and operational transformation. With a strong track record in technology-enabled solution design and rigorous options assessment, Trace serves a diverse client base spanning government and defence, healthcare and aged care, FMCG and manufacturing, hospitality, retail, and critical infrastructure across Australia.

Trace's deep expertise in network design, cost-to-serve analysis, inventory optimisation, and supply chain resilience aligns directly with Optilogic's AI-first technology approach, enabling unified modelling of complex supply chain environments, particularly those shaped by Australia's unique geography, vast distribution distances, and the operational complexity of serving both metropolitan and remote communities.

Trace will deploy Optilogic's Cosmic Frog for enterprise supply chain optimisation and real-time scenario modelling to support:

  • Network Design and Optimisation
  • Inventory Optimisation
  • Transportation and Distribution Strategy
  • Cost-to-Serve Analysis
  • Supply Chain Resilience and Risk Modelling
  • AI-accelerated scenario evaluation and service-level trade-offs

Optilogic's AI-powered platform will allow Trace to collapse modelling time from months to days, evaluate strategic alternatives with greater accuracy, and deliver deeper insights to clients across government, defence, healthcare, retail, and manufacturing.

"Partnering with Optilogic is a natural extension of how we work at Trace, combining deep supply chain expertise with advanced analytics and technology to deliver real-world results. Cosmic Frog gives us the ability to model complex networks, evaluate hundreds of scenarios rapidly, and provide our clients with the strategic confidence to make better decisions, faster. For Australian organisations navigating supply chain complexity, this partnership means access to world-leading design tools backed by a team that understands their operating environment," Mathew Tolley, Co-Founder & Partner, Trace Consultants.

"We are excited to partner with Trace Consultants as they bring AI-first supply chain design to the Australian market. Trace's reputation for delivering practical, technology-driven outcomes, combined with Optilogic's platform, will set a new benchmark for supply chain design across the region," Chris Edwards, Vice President, Asia-Pacific.

About Trace Consultants

Trace Consultants is an Australian supply chain consultancy specialising in strategy, operations, and technology. With decades of hands-on experience across government and defence, healthcare, retail, hospitality, FMCG, and critical infrastructure, Trace brings deep technical capability in solution design, options assessment, and technology implementation. The firm works closely with clients to model, design, and implement optimal supply chain strategies, turning data-led analysis and scenario modelling into measurable results.

About Optilogic

Optilogic is an AI-first supply chain design company that revolutionises decision-making by transforming modelling from a three-month project into one-day breakthroughs. We combine AI, mathematical optimisation, and simulation to help enterprises shift from data preparation to strategic network design decisions. Our platform empowers teams to answer critical what-if questions in real-time and optimise complex supply chain networks, while our Solutions team provides hands-on expertise to ensure rapid success. We give supply chain professionals superpowers by automating tedious work so they can focus on strategic thinking that creates business value. Learn more about Optilogic at optilogic.com

People & Perspectives

In Conversation at Trace: Tim Harris on systems, decision-making, and designing for resilience

Jaimee Lee
March 2026
Senior Manager Tim Harris shares his journey from crisis logistics in Africa to CIO at Border Express, discussing what he's learned about building resilient systems, leading through disruption, and making technology work in the real world.

Tim Harris doesn't fit the typical consultant mould, and that's exactly why he's so effective. He's spent much of his career on the operational front line, leading teams as CIO at Border Express, delivering major programs at Victoria Police, working as COO at a WMS implementation partner, and spending the early part of his career in humanitarian logistics across Africa. 

Tim Harris, Senior Manager

We sat down with Tim to talk about what shaped his approach to problem-solving, the lessons he's carried from humanitarian operations into commercial environments, and what organisations consistently underestimate when modernising their supply chains.

You've built a career that spans humanitarian logistics, law enforcement, and commercial operations. Which experiences have been most formative in shaping how you solve problems today?

TH: Early in my career, I spent nearly a decade working in humanitarian logistics across Africa, Albania, Kosovo, Russia, Mozambique, Tanzania, Angola, Uganda, Malawi, and South Africa, responding to natural disasters and food shortages between 1999 and 2007. When you’re establishing distribution operations in crisis zones, you quickly learn that perfect information doesn't exist, resources are always constrained, and the cost of failure isn't measured in dollars, it's measured in lives. That experience taught me to make decisions with incomplete data, build systems that are resilient by design rather than by accident, and always focus on the outcome rather than the process.

At Victoria Police, I transitioned into a more structured environment, overseeing critical equipment programs and asset management across the state. Managing equipment where accountability is non-negotiable, where every item must be tracked and every process auditable, instilled a discipline around governance, compliance, and systematic thinking that I carry into every project.

At Border Express, I had the opportunity to apply both of those foundations at scale. I led the development of item-level freight tracking, which became foundational to the business. I then headed the project to develop the parcel network, which generated $20 million in revenue in its first twelve months. Those projects taught me how to translate operational innovation into commercial outcomes—how to build the business case, align stakeholders, and deliver technology that genuinely moves the needle.

Critical to all of this has been my ability to communicate across levels, from an operator on the floor to the board. When you're leading large projects that impact the whole business, communication is everything. Today, my problem-solving draws on all three experiences: the pragmatism from working in austere environments, the rigour of managing highly accountable systems, and the commercial lens for building solutions that create value.

You've led operations from the inside and now advise organisations as a consultant. How does sitting on both sides of the table change the way you work with clients?

TH: Having sat in the chair makes a significant difference. As CIO at Border Express for three years, I was accountable for technology decisions that affected every part of the operation. I lived with the consequences of those decisions, good and bad. I've also held executive roles as COO at Open Sky Group, a boutique Blue Yonder WMS implementation partner, and as Head of Program Management at Körber. Those roles gave me deep exposure to how technology vendors and implementation partners operate, which is invaluable when helping clients navigate procurement and delivery.

That dual perspective changes my approach in three ways.

I understand the internal politics. When I'm working with a client's IT team, operations leadership, and finance function, I know they often have competing priorities. I've been in those conversations. I can help bridge those gaps because I've had to do it myself.

I'm realistic about what technology can and can't do. Having implemented WMS and TMS solutions from the vendor side and operated them from the client side, I can cut through the sales narrative. I know which features genuinely deliver value and which are impressive in a demo but problematic in practice.

I bring operational credibility. At Trace, I've been heavily involved in providing operational expertise across warehousing in manufacturing, government, and retail distribution. When I'm advising on a warehouse strategy or 3PL benchmarking exercise, I'm not just applying frameworks, I'm drawing on direct experience running operations, managing P&Ls, and making the trade-offs that every operations leader faces.

Clients appreciate that I'm not giving them theoretical advice. I've made the decisions they're facing, and I've lived with the outcomes.

From your experience, what separates organisations that navigate disruption well from those constantly firefighting?

TH: The organisations that manage disruption well share three characteristics:

They have visibility before they need it. Resilient organisations invest in supply chain visibility when things are running smoothly, not when a crisis forces them to. They know their tier-two and tier-three suppliers, understand the geographic concentrations of risk, and have dashboards that surface exceptions early. When disruption hits, they're not scrambling to understand their exposure; they already know it.

They've done the scenario planning. The best operators have thought through their response to major disruptions before they happen. They've mapped alternative suppliers, identified backup logistics routes, and stress-tested their inventory buffers. During the pandemic, the organisations that coped best weren't necessarily the ones with the most resources but the ones who had contingency plans they could activate. Proactive risk management is cheaper than reactive crisis management.

They have empowered decision-makers close to the operation. In a disruption, centralised decision-making creates bottlenecks. Resilient organisations push authority down so site managers and operations leads can make calls without waiting for head office approval. This requires trust, clear decision frameworks, and a culture that doesn't punish people for acting decisively in ambiguous situations.

The reactive organisations I've seen typically share the opposite profile: limited visibility, no contingency planning, and overly centralised control. When disruption hits, they're making decisions with incomplete information, discovering problems late, and waiting for approvals while the situation deteriorates.

The shift from reactive to proactive isn't primarily about technology, it's about mindset and investment priorities. It's choosing to spend money on resilience before you're forced to spend more on recovery.

You started your career in disaster relief and high-pressure humanitarian logistics. What lessons from those environments still shape how you think about resilience and decision-making?

TH: I began my career overseeing warehouse and distribution operations in Albania and Kosovo, and then spent nearly a decade working on global relief efforts in Mozambique, Tanzania, Angola, Uganda, Malawi, and South Africa, responding to natural disasters and food shortages between 1999 and 2007. That experience shaped my thinking in ways that still influence how I approach every project.

On resilience: In humanitarian operations, you learn that systems will fail. Roads wash out, suppliers don't deliver, equipment breaks. Resilience isn't about preventing failure, it's about designing operations that can absorb failure and keep functioning. You build redundancy, cross-train people, and preposition stock in multiple locations. That mindset applies directly to commercial supply chains: the question isn't whether disruption will happen, but whether your operation can continue when it does.

On preparedness: In relief operations, the organisations that responded fastest were those that had prepositioned supplies, established relationships with local partners, and rehearsed their deployment processes before the crisis. Preparedness is an investment you make when you don't need it, so it's available when you do. I carry that into commercial settings, encouraging clients to invest in visibility tools, supplier diversification, and contingency planning before disruption forces them to.

On decision-making under pressure: When people's lives depend on your logistics operation, you can't wait for perfect information. You make the best decision you can with what you know, act, and adjust as you learn more. That comfort with ambiguity has served me well in commercial environments. It's about making decisions when you're 70% confident rather than waiting for 95%, where speed often matters more than precision.

Those years taught me that logistics isn't just about efficiency. At its core, it's about ensuring the right things reach the right people when they need them. That purpose still drives how I think about supply chain work.

As CIO at Border Express, you were accountable for connecting technology investment to business performance. What lessons from that role still guide how you approach technology today?

TH: As CIO at Border Express, I was responsible for technology decisions in a business where margins are tight and operational performance is everything. That environment taught me several lessons I still apply.

Start with the business problem, not the technology. The most successful projects I led—item-level freight tracking, the parcel network, and the regional on-forwarder program—started with a clear commercial or operational need. The parcel network wasn't a technology project; it was a growth strategy that required technology to execute. That $20 million in first-year revenue came from solving a market opportunity, not from implementing software. When technology investments are framed around business outcomes, they get funded, prioritised, and supported through the inevitable implementation challenges.

Build the business case with rigour but design for learning. Every investment needs a solid ROI case, that's non-negotiable in a commercial environment. But I also learned to build programs in phases that deliver value incrementally and allow us to learn and adjust. Large, monolithic projects that promise transformation in eighteen months are high-risk. Projects that deliver tangible wins in three to six months, then build on that foundation, are more likely to succeed and sustain executive support.

Technology is only valuable if people use it. The best system in the world is worthless if the operations team works around it. I learned to invest as much in change management, training, and process redesign as in the technology itself, and to involve operations early not just IT, so the solution reflects how work actually gets done.

Don't confuse activity with outcomes. It's easy to measure project milestones, go-live dates, and system uptime. What matters is whether the business is performing better: faster delivery times, lower cost-to-serve, improved customer satisfaction. I try to ensure every technology conversation comes back to the metrics that matter to the business.

Looking ahead, what shifts or innovations in supply chain technology and operations are you most excited about, and why?

TH: Three areas genuinely excite me.

The maturation of AI from hype to practical application. We're past the point where AI is just a vendor talking point. I'm seeing real-world applications in demand forecasting that integrate external signals such as weather, events and social trends to significantly improve accuracy. Predictive analytics for exception management means operations teams receive alerts about problems before they escalate into crises, not after. The shift from reactive firefighting to proactive intervention changes how operations leaders spend their time and dramatically improves service outcomes.

The convergence of WMS and TMS into unified platforms. Historically, these systems operated in silos. The TMS would create a shipment plan, hand it to the WMS, and have no visibility into execution until the truck was loaded. The next generation of platforms shares data continuously, so shipment planning can reoptimise in real time based on what's happening in the warehouse. That integration eliminates a lot of the friction and inefficiency I've seen in traditional implementations.

Embedding sustainability into supply chain decision-making. For a long time, sustainability was a reporting obligation rather than an operational driver. That's changing. Route optimisation now considers emissions, not just cost and time. Network design considers the carbon footprint alongside service levels. Customers, particularly in retail and FMCG, are demanding visibility into the environmental impact of their supply chains. This isn't just about compliance, it's becoming a source of competitive advantage.

What excites me most is that these innovations aren't just about efficiency, they're about building supply chains that are more responsive, resilient, and sustainable. Having spent the early part of my career in environments where supply chains genuinely mattered to people's lives, I find it encouraging to see commercial supply chains embrace that same sense of purpose.

What sets Tim apart is simple: he's sat in the chair. He's led the transformations, built the systems, made the calls, and lived with what happened next. That experience shapes everything he brings to clients at Trace.

Planning, Forecasting, S&OP and IBP

Going to Market for an APS Solution: What Australian Businesses Need to Know

Mathew Tolley
March 2026
Advanced planning and scheduling technology is a significant investment — and the market is crowded with vendors promising transformational results. Here's how to run a selection process that actually delivers the right platform for your operation.

If you've reached the point where your planning and scheduling processes can't keep up — where spreadsheets are buckling under the weight of your product mix, your ERP's planning module is generating schedules that nobody trusts, and your planning team spends more time firefighting than actually planning — then you're probably looking at advanced planning and scheduling (APS) software.

You're not alone. The global APS software market was valued at roughly USD 2.8 billion in 2025 and is projected to grow at around 10–20% annually through the end of the decade, depending on whose numbers you use. Cloud-based deployment now accounts for over 60% of new installations, and the integration of AI and machine learning into planning algorithms is accelerating fast. For Australian manufacturers, distributors, and supply chain operators, the case for better planning technology is getting harder to ignore.

But here's the thing: going to market for an APS solution is one of the more consequential technology decisions a supply chain organisation will make. Get it right, and you unlock genuine step-changes in service levels, inventory performance, production efficiency, and decision-making speed. Get it wrong, and you're looking at a six- or seven-figure investment that never delivers its promised returns — or worse, a system that the planning team quietly works around because it doesn't reflect how the operation actually runs.

This article is a practical guide for Australian businesses thinking about going to market for APS. It covers what APS actually does, when it makes sense to invest, how to structure a selection process that produces a good outcome, and the mistakes that trip most organisations up along the way.

What Is APS, and How Is It Different From What You've Already Got?

Advanced planning and scheduling software simultaneously plans and schedules production, procurement, and distribution by considering available materials, labour, and plant capacity together — in real time. That last part is what makes it fundamentally different from the planning modules embedded in most ERP systems.

Traditional MRP (material requirements planning) and the planning functions inside ERPs like SAP, Oracle, or MYOB Advanced work sequentially. They calculate material requirements first, then try to fit those requirements into a production schedule, typically assuming infinite capacity. The result is a plan that looks reasonable on paper but falls apart the moment it hits the constraints of the real operation — machine availability, changeover times, labour shifts, material lead times, minimum batch sizes, and all the other messy realities of actually making things.

APS works differently. It models the operation's actual constraints — finite capacity, real material availability, sequencing rules, setup dependencies, labour rostering — and produces plans and schedules that are feasible from the start. Good APS platforms also support what-if scenario modelling, letting planners test the impact of accepting an urgent order, bringing forward a maintenance window, or reallocating capacity between production lines before committing to a decision.

For businesses where planning complexity is genuinely simple — a narrow product range, stable demand, limited make-to-order work — the planning module in your ERP may be perfectly adequate. APS earns its keep where one or more of the following conditions are present: high product mix competing for shared capacity, significant make-to-order or configure-to-order production, capital-intensive processes where machine utilisation matters, frequent schedule changes driven by demand variability or supply disruptions, or multi-site operations requiring coordinated planning across facilities.

If any of that sounds familiar, you're in APS territory.

When Is the Right Time to Go to Market?

Timing matters. Going to market too early — before you've properly understood the problem you're solving — leads to vendor-led selection processes where the technology shapes the conversation rather than the operation's needs. Going too late, when the pain is acute and leadership is demanding a solution immediately, compresses the timeline and forces shortcuts that compromise the outcome.

The right time to go to market is when you've done the foundational work to understand three things clearly.

First, what's actually broken in your current planning process. This isn't "we need better planning" — that's a symptom, not a diagnosis. Is the problem demand forecasting accuracy? Production scheduling feasibility? Inventory positioning? Supplier lead time variability? The inability to respond quickly to changes? Each of these points to different APS capabilities, and understanding the root cause shapes the requirements.

Second, what your target operating model looks like. How do you want planning and scheduling to work in three to five years? What level of automation do you want in the planning process? How should planning interact with sales, procurement, and the shop floor? What decisions should planners be making versus what should the system handle? This is where planning and operations strategy and APS technology selection intersect — and where many organisations make the mistake of jumping to software before defining the operating model.

Third, what your integration landscape looks like. No APS operates in isolation. It needs clean data from your ERP — bills of material, routings, work centres, inventory levels, sales orders, purchase orders. It may need to interface with a manufacturing execution system (MES), a warehouse management system, or a transport management system. Understanding the integration requirements and the quality of your master data before going to market saves enormous pain during implementation.

Once you have clarity on those three things, you're ready to engage the market properly.

Structuring the Selection Process

A well-run APS selection process typically follows a sequence that looks something like this: requirements definition, market scan, long-list, shortlist, detailed evaluation, and final selection. Each stage has a purpose, and skipping stages is where the problems start.

Requirements Definition

This is the non-negotiable foundation. A structured requirements document captures the functional capabilities the APS must deliver (demand planning, production scheduling, capacity planning, material planning, what-if analysis, and so on), the non-functional requirements (performance, scalability, security, user experience), and the integration requirements (what systems the APS must connect with, what data flows are needed, and what the latency and frequency requirements are).

The requirements should distinguish between must-haves — capabilities the system absolutely needs on day one — and desirables, which would improve the operation but aren't essential at launch. This distinction matters because it prevents the selection from being dominated by feature checklists that obscure the genuinely critical requirements.

A good requirements process also documents the operational context — what does the planning team actually do day-to-day? What decisions do they make? What data do they use? What workarounds have they built? This operational understanding is what separates a requirements document that drives a good selection from one that reads like a generic wish list.

This is an area where having an independent advisor — someone who's seen enough APS implementations to know which requirements actually matter in practice — makes a material difference. Internal teams often lack the cross-industry perspective to benchmark their requirements against what's realistic and what's overkill. A firm like Trace Consultants that works across manufacturing, retail, government, and services can bring that perspective.

Market Scan and Long-List

The APS market is crowded. At the enterprise end, you've got platforms from the likes of Kinaxis, o9 Solutions, Blue Yonder, SAP IBP, and Oracle. In the mid-market, there's DELMIA Quintiq (Dassault Systèmes), Opcenter APS (Siemens), PlanetTogether, Logility, and others. At the smaller end, solutions like Tactic, CyberPlan, and various ERP-embedded modules serve less complex operations.

The market scan identifies which vendors are credible candidates for your specific requirements. Not all APS platforms are created equal — some are stronger in production scheduling, others in demand planning or supply network optimisation. Some are purpose-built for process manufacturing (food, beverages, chemicals), while others are designed for discrete manufacturing (machinery, electronics, automotive). Getting the sector and complexity fit right at the long-list stage saves significant time later.

For Australian businesses, local support and implementation capability is a practical consideration that's easy to overlook. A platform might be market-leading globally, but if the vendor's nearest implementation team is in Chicago and there's no local partner with deep APS experience, you're carrying additional risk and cost. Understanding the vendor's ANZ footprint — direct presence, certified partners, existing customer base — should be part of the assessment.

Shortlist and Detailed Evaluation

The shortlist — typically three to four vendors — should be evaluated through structured demonstrations scripted against your operational scenarios, not the vendor's standard demo. This is a critical distinction. Every APS vendor can show you a polished demo using their reference data set. What you need to see is how the platform handles your product mix, your constraints, your scheduling rules, and your planning complexity.

A scripted demonstration provides a test data set and a set of planning scenarios that reflect your actual operation. You ask each vendor to configure their platform against that data and demonstrate how it handles the scenarios. This levels the playing field, exposes genuine capability gaps, and gives the planning team — who should absolutely be in the room — the ability to assess whether the tool will actually work in their world.

Alongside the demonstrations, reference checks with comparable operations are essential. Ask the vendor for references in your industry, of similar scale and complexity, preferably in the ANZ region. Talk to the planning managers, not the CIO — the people who actually use the system every day. Ask what they'd do differently. Ask what surprised them during implementation. Ask whether the system delivers what was promised during the sales process.

The evaluation should also include a total cost of ownership (TCO) analysis that looks beyond the licence fee. Implementation costs, integration development, data migration, training, ongoing support, and the internal effort required from your team all factor into the true cost. For cloud-based APS platforms, the subscription model smooths the upfront investment but the cumulative cost over five to seven years can exceed an on-premise deployment — it depends on the platform and your scale.

Final Selection

The final selection should synthesise all the evidence — functional fit, integration feasibility, vendor capability, reference feedback, TCO, and strategic alignment. It's worth noting that there's rarely a perfect answer. Every platform will have trade-offs. The goal is to select the platform that best fits your requirements and your organisation's ability to implement and sustain it, not the platform with the longest feature list.

The Mistakes That Trip Most Organisations Up

Having seen how APS selections play out across a range of Australian businesses, there are patterns worth calling out.

Letting the Vendor Drive the Conversation

This is the single biggest risk. APS vendors are sophisticated sales organisations. They know how to steer conversations toward their platform's strengths and away from its limitations. Without a clear set of requirements and a structured evaluation process, it's remarkably easy to end up selecting the platform that gave the best presentation rather than the one that's the best fit.

The antidote is simple: own the process. Define the requirements before you talk to vendors. Script the demonstrations. Control the evaluation criteria. Use an independent advisor if you don't have the internal capability to manage this — it's a fraction of the cost of getting the selection wrong.

Over-Specifying the Solution

There's a temptation, particularly in larger organisations, to select the most sophisticated platform on the market on the assumption that you'll "grow into it." This sounds reasonable but often plays out poorly. Enterprise-grade APS platforms are powerful but complex. They require significant configuration, substantial data quality, skilled users, and ongoing investment to maintain. If your organisation isn't ready for that level of complexity — if your master data is patchy, your planning processes are immature, or your team doesn't have the analytical capability to use the tool effectively — you'll end up with an expensive platform running at a fraction of its potential.

A better approach is to match the APS tier to your current maturity and your realistic three-year trajectory. A mid-market APS that's well-implemented and well-adopted will outperform an enterprise platform that's under-utilised. This is where honest self-assessment — or an independent maturity assessment from an advisor — pays dividends.

Underinvesting in Data Readiness

APS systems are only as good as the data they consume. If your bills of material are inaccurate, your routings don't reflect actual cycle times, your inventory records are unreliable, or your demand signals are noisy, the APS will produce plans that nobody trusts. And when the planning team doesn't trust the system, they revert to spreadsheets — which is exactly where you started.

Data readiness should be treated as a workstream in its own right, starting before the APS implementation begins. This means auditing and cleansing master data, establishing data governance processes, and ensuring the data pipeline from ERP to APS is reliable and timely. It's unglamorous work, but it's the difference between an APS that delivers value and one that sits alongside the planning team's "real" spreadsheets.

Treating Implementation as a Software Project

This parallels what we see in warehouse management technology projects. An APS implementation changes how the planning team works. It changes their daily routines, their decision-making processes, their interactions with sales, procurement, and the shop floor. It may change roles and responsibilities. It may require new skills.

Organisations that treat APS implementation as a software deployment — hand it to IT, configure it, switch it on — consistently underperform. The ones that succeed invest in change management, process redesign, training, and the organisational effort required to embed new ways of working. They recognise that the technology is the enabler, not the solution.

Ignoring the Planning Operating Model

This is perhaps the most subtle but most important point. An APS is a tool that supports a planning process. If the planning process itself is poorly designed — unclear roles, fragmented decision rights, no structured cadence of planning meetings, no connection between demand planning and supply planning — then layering technology on top will amplify the dysfunction, not fix it.

Before going to market for an APS, it's worth investing in planning and operations design work. Define the planning operating model: What are the key planning processes? Who makes which decisions? What's the rhythm of the planning cycle? How does planning connect to execution? This work doesn't require technology — it requires clear thinking about how the organisation should plan. The APS then becomes the tool that enables that model.

The AI Question

It's impossible to discuss APS in 2026 without addressing artificial intelligence. Every vendor in the market is now leading with AI capabilities — AI-powered demand sensing, machine learning-optimised scheduling, autonomous planning, predictive analytics. Some of this is genuine and valuable. Some of it is marketing ahead of reality.

The practical state of AI in APS today is that machine learning is delivering real value in demand forecasting — identifying patterns in historical data, incorporating external signals (weather, promotions, events), and improving forecast accuracy at the SKU level. AI-driven scheduling optimisation is also maturing, particularly for complex sequencing problems where the number of possible combinations exceeds what heuristic rules can handle efficiently.

What AI is not yet doing reliably is replacing the judgement of experienced planners. The best APS implementations use AI to augment planners — providing better inputs, faster scenario analysis, and recommended actions — while keeping humans in the decision loop for the exceptions, trade-offs, and business context that algorithms can't fully capture.

When evaluating AI capabilities in APS vendors, focus on practical outcomes rather than buzzwords. Ask for evidence of AI improving forecast accuracy or scheduling efficiency in comparable operations. Ask how the AI models are trained and validated. Ask what happens when the AI gets it wrong — how does the planner override and the system learn?

How Trace Consultants Can Help

Trace Consultants is an Australian supply chain consultancy that helps organisations get APS selection and implementation right. Our job is to make sure the technology you invest in genuinely fits your operation.

Here's where we typically add value:

Planning maturity assessment. Before you go to market, we assess the current state of your planning processes, data quality, organisational capability, and planning and operations model. This work identifies what needs to be fixed before technology is layered on, and shapes the requirements for the APS selection.

Requirements definition. We work with your planning, operations, and technology teams to build a structured requirements specification — functional, non-functional, and integration — grounded in how the operation actually works and where it needs to get to. We bring cross-industry perspective from working across FMCG and manufacturing, retail, government and defence, and property, hospitality and services.

Market scan and vendor evaluation. We know the APS market — who does what well, where the strengths and limitations are, and which platforms suit which types of operation. We run structured selection processes including scripted vendor demonstrations, reference checks, and total cost of ownership analysis.

Implementation oversight. We work alongside your team and the vendor through implementation to keep the project focused on operational outcomes. This includes process redesign, data readiness, training design, and change management — the things that determine whether the APS actually sticks.

Broader supply chain strategy. APS selection often sits alongside bigger questions about your distribution network, procurement operating model, workforce planning, or organisational design. We help clients connect the technology decision to the wider strategic context so you're not optimising in isolation.

If you're thinking about going to market for an APS — or if you've already started and the process isn't going as planned — get in touch. We'd welcome the conversation.

The Bottom Line

Going to market for an APS solution is a significant undertaking. The technology has never been more capable, and the market has never offered more choice. But choice without structure leads to poor decisions. The organisations that get the best outcomes are the ones that invest in understanding their requirements before they talk to vendors, run a disciplined evaluation process, match the technology tier to their actual complexity, and invest in the data, processes, and people that make the technology work.

It's not the most exciting part of supply chain transformation. But it's the part that determines whether the investment delivers.

Trace Consultants is an Australian supply chain and procurement consultancy specialising in strategy, operations, and technology. For more insights, visit our insights page or explore our technology advisory services.